October brought a subtle shift across the Greater Toronto Area. While persistent economic uncertainty, high fixed mortgage rates, and the Bank of Canada’s recent 25-basis-point rate hike to 2.50% kept a chunk of prospective buyers cautious, the real story this fall is happening on the supply side.
New listings dropped by 11.9% year-over-year (and down 14.1% month-over-month), steadily draining active inventory. This pullback in supply prevented standing inventory from flooding the market and helped firm up average selling prices across the region compared to late summer.
October at a Glance: The Key Numbers (All TRREB Areas)
Average Selling Price: $1,024,108 (-2.7% YoY | +1.8% MoM)
Total Sales: 5,603 (-7.9% YoY | +11.2% MoM)
New Listings: 14,173 (-11.9% YoY | -14.1% MoM)
Active Listings: 25,098 (-10.0% YoY | -4.0% MoM)
Average Time on Market: 31 Listing Days (LDOM) / 49 Property Days (PDOM)
Average Sale-to-List Price Ratio: 97%
Months of Inventory: 4.48 Months (Balanced Market)
Macro Economic & Rate Context
Bank of Canada Move: On October 28, the Bank of Canada bumped its overnight rate up by 25 bps to 2.50%, pushing prime rates to 4.50% and lowest variable mortgage rates to around 3.70%.
Fixed Mortgage Rates: Tracked stickier government bond yields, holding firm in the 5.49% to 6.19% range.
Inflation & Growth: The rate bump was triggered by core inflation sitting at 3.1% in September and strong Q2 GDP growth (3.3%), signaling that policy rate cuts remain on pause for now.
Consumer Sentiment: Trade tensions and employment uncertainty continued to induce buyer hesitation, though lower selling prices compared to 2023/2024 peak levels have helped keep monthly mortgage payments manageable.
Property Type Breakdown across TRREB
Detached Homes: Recorded 2,693 sales (-6.2% YoY) with an average price of $1,310,627 (-3.2% YoY).
Semi-Detached Homes: Totaled 546 sales (-8.1% YoY) with an average selling price of $1,024,907 (-0.8% YoY).
Townhouses: Posted 508 sales (-11.0% YoY) at an average price of $905,385 (-5.0% YoY).
Condo Apartments: Saw 1,385 sales (-10.4% YoY) with an average selling price of $621,400 (-5.8% YoY).
Inside the Regions: Toronto vs. Durham Region
City of Toronto (416)
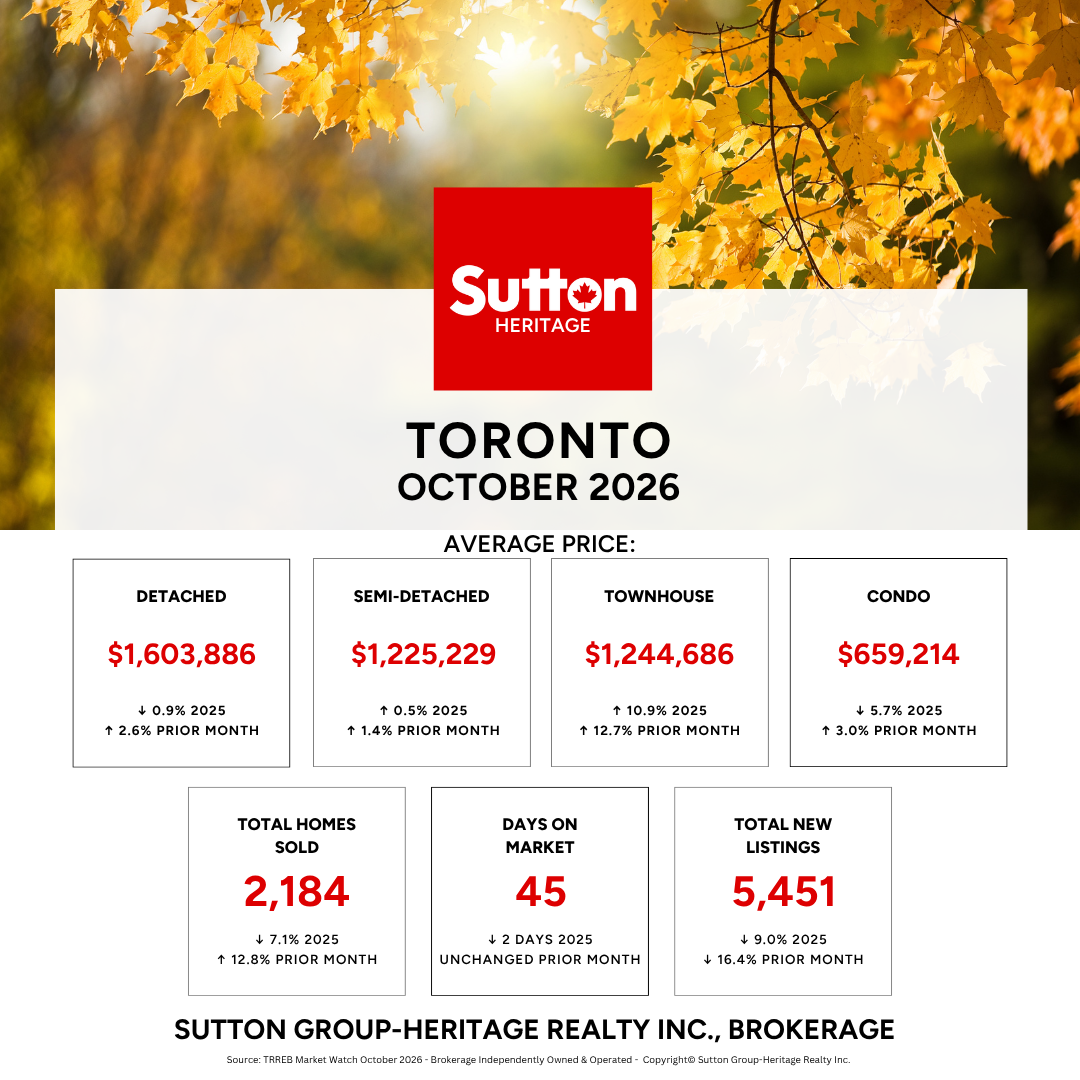
Toronto proper demonstrated strong month-over-month price momentum across almost all property types, bolstered by a sharp 16.4% drop in new listings MoM.
Total Sales: 2,184 (-7.1% YoY | +12.8% MoM)
Average Price: $1,075,627
Detached: $1,603,886 (-0.9% YoY | +2.6% MoM)
Semi-Detached: $1,225,229 (+0.5% YoY | +1.4% MoM)
Townhouse: $1,244,686 (+10.9% YoY | +12.7% MoM) — The standout performer in the 416 core.
Condo Apartment: $659,214 (-5.7% YoY | +3.0% MoM)
Days on Market: 45 Property Days
Durham Region (905)
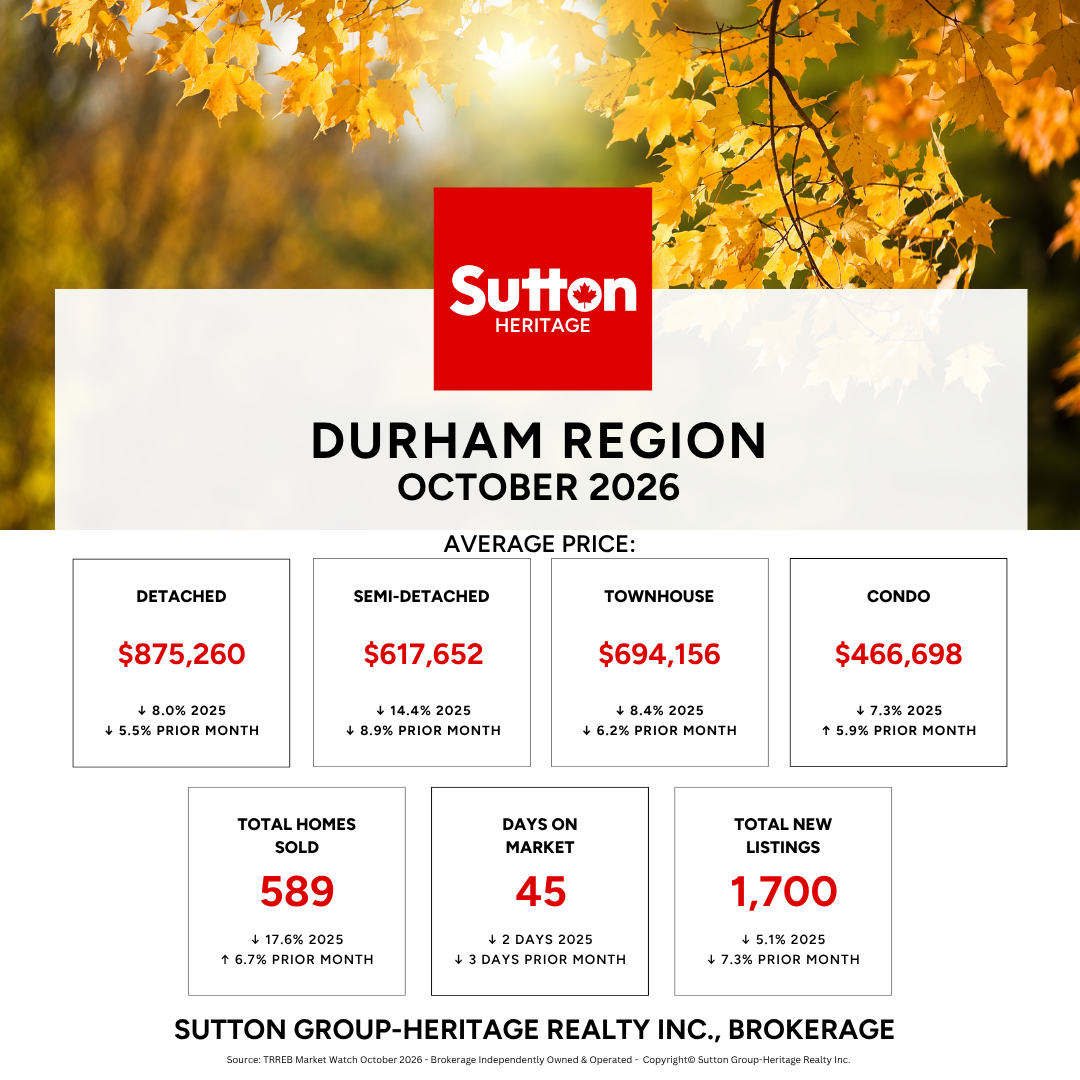
Durham Region offered accessible pricing points for buyers, though freehold values experienced modest softening month-over-month.
Total Sales: 589 (-17.6% YoY | +6.7% MoM)
Average Price: $793,024
Detached: $875,260 (-8.0% YoY | -5.5% MoM)
Semi-Detached: $617,652 (-14.4% YoY | -8.9% MoM)
Townhouse: $694,156 (-8.4% YoY | -6.2% MoM)
Condo Apartment: $466,698 (-7.3% YoY | +5.9% MoM)
Days on Market: 45 Property Days
What Does This Mean for You Heading Into Year-End?
For Buyers: Substantial Negotiating Power
Leverage in Negotiations: With average sale-to-list price ratios holding at 97%–98% and homes averaging 45 to 49 property days on market, buyers have room to include conditions and negotiate terms.
Price Floor Stability: Active inventory is down 10% year-over-year, meaning prices are stabilizing rather than plummeting. If you're waiting for a drastic price crash before entering the market, current inventory trends suggest prices are holding steady.
For Sellers: Strategic Pricing is Essential
Compete on Presentation & Price: Shrinking active inventory provides support against steep price drops, but elevated days on market mean buyers are taking their time.
Realistic Alignment: Properties priced at current fair market value are moving smoothly, whereas over-priced listings are sitting and requiring price adjustments.
Looking Ahead to Q4
As we move toward the final weeks of 2026, the GTA market is settling into a balanced state. Supply contraction is keeping prices grounded around the $1.00M–$1.02M mark, while elevated mortgage rates prevent a sudden surge in buyer frenzy. Expect steady, measured activity heading into the winter months.
Need Strategy, Not Guesswork?
Whether you’re planning your next move in Toronto, Durham Region, or across the GTA, having a localized strategy makes all the difference. Reach out today for a personalized consultation!