


If you’ve been watching the Toronto and Durham real estate markets, you might be wondering why the news feels full of mixed signals. Headline numbers talk about sales dipping, while on the ground, buyers and sellers are navigating a market shaped by changing mortgage dynamics, seasonal inventory surges, and economic holding patterns.
Let's break down what actually happened across the Greater Toronto Area, Toronto, and Durham Region in September 2026, and what it means for your next move.
The Big Picture across the GTA
Across the entire Toronto Regional Real Estate Board (TRREB) area, September showed a market where buyers remained cautious amidst borrowing cost uncertainty, while sellers adjusted to early autumn expectations:
Total Sales: 5,040 (-9.0% YoY)
Average Selling Price: $1,006,409 (-5.1% YoY)
New Listings: 16,500 (-14.4% YoY)
Active Listings: 26,131 (-9.3% YoY)
Days on Market (Avg. LDOM): 34 days
Property Days on Market (Avg. PDOM): 51 days
Sales-to-List Price Ratio: 98%
While overall sales slowed compared to last September, supply also contracted, keeping inventory from over-accumulating and keeping negotiation room grounded around 98% of list price.
City of Toronto Market Breakdown
Toronto saw a classic post-Labour Day influx of new listings alongside a notable uptick in month-over-month sales activity.
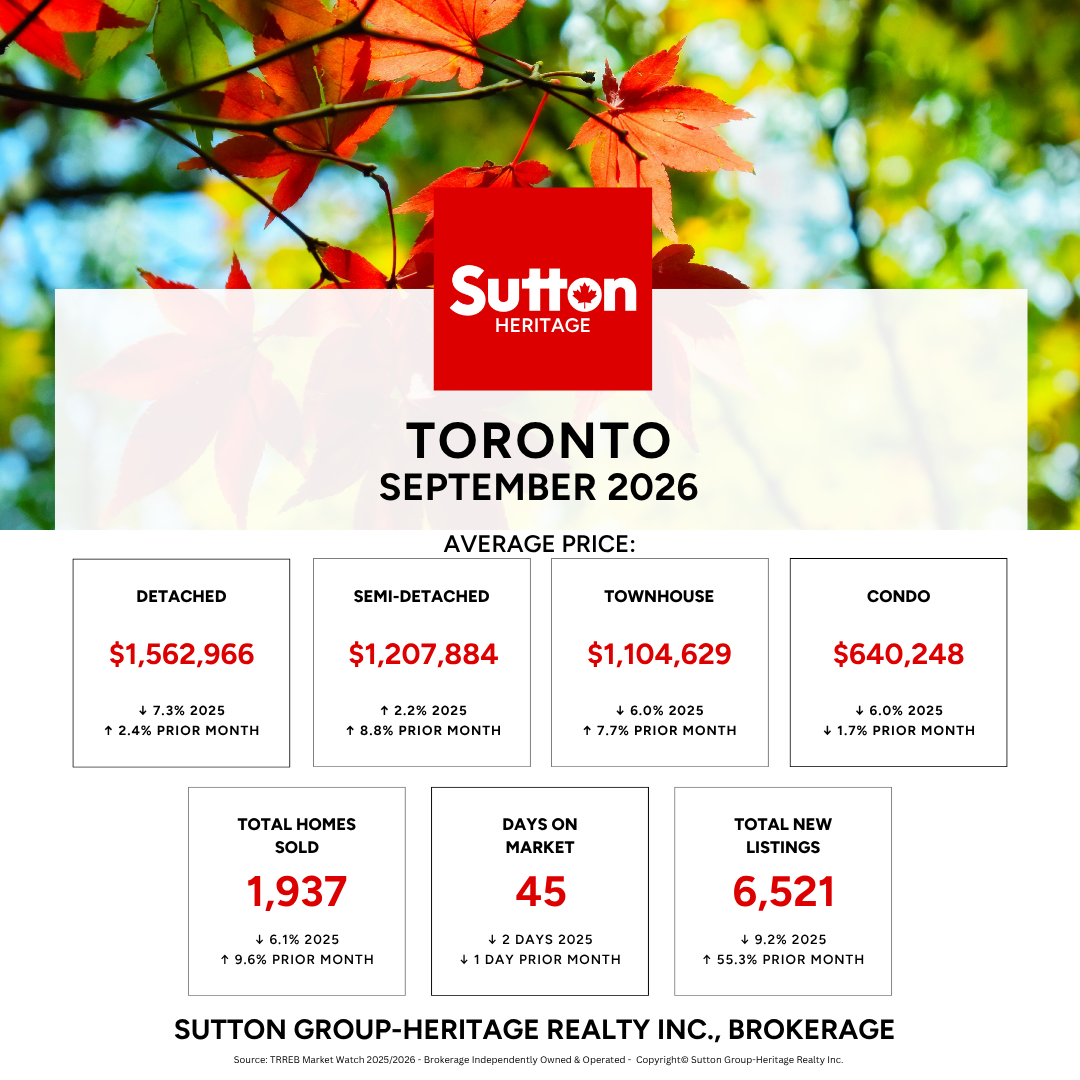
Key Toronto Insights
Freehold Demand Bounced Back Month-over-Month: Semi-detached homes ($1,207,884) and townhouses ($1,104,629) posted strong month-over-month price growth of +8.8% and +7.7% respectively, demonstrating sustained buyer demand for mid-tier freehold options.
Fall Inventory Arrived: New listings surged +55.3% from August to 6,521 homes, offering buyers significantly more choice than in the summer months.
Condos Remain Soft: Condo average prices dipped slightly month-over-month (-1.7%) to $640,248 as higher inventory levels in the condo sector gave buyers the upper hand during negotiations.
Durham Region Market Breakdown
Durham Region continued to offer an appealing blend of relative affordability and community appeal, though seasonal shifts were clearly evident.
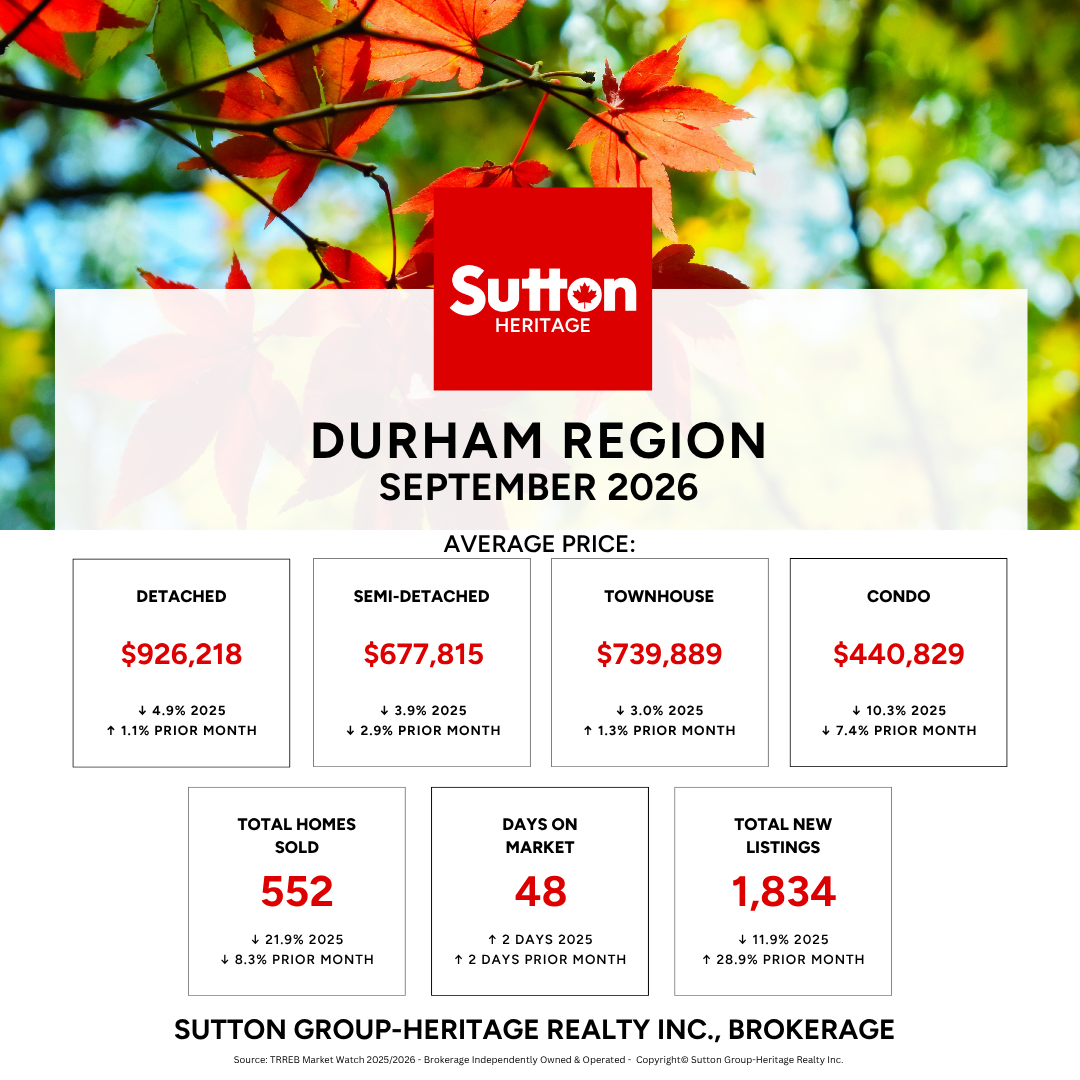
Key Durham Insights
Detached & Townhouse Resilience: Single-family detached homes ($926,218) and townhouses ($739,889) both saw modest price increases month-over-month (+1.1% and +1.3%), reflecting steady family-home demand across Ajax, Whitby, Oshawa, and Pickering.
Slower Pace of Sales: Total sales dropped -8.3% month-over-month to 552 units, while Days on Market ticked up to 48 days, giving buyers extra room to inspect properties and finalize financing without feeling rushed.
Condo Opportunity: Condo apartment prices in Durham dropped to $440,829 (-7.4% MoM), creating an accessible entry point for first-time buyers looking to get onto the property ladder.
Behind the Numbers: Interest Rates & Mortgage Dynamics
Heading into October, borrowing dynamics played a major role in buyer behavior:
The Fixed vs. Variable Gap: While the Bank of Canada held its overnight policy rate steady at 2.25% in its early September announcement, 5-year fixed mortgage rates edged upward due to rising bond yields. Variable rate options remained lower, creating a wider-than-usual rate spread and forcing buyers to choose between fixed stability or lower initial variable payments.
Pent-Up Demand in a Holding Pattern: Many prospective buyers are sitting on pre-approvals, waiting for inflation trends and rate expectations to settle before locking into longer-term financing.
Strategic Pricing Matters: With new listings up significantly from August (+55.3% in Toronto, +28.9% in Durham), sellers who price accurately based on recent local comps are securing firm sales, while over-priced listings are sitting past the 40-to-50-day mark.
What This Means for You
For Buyers: Fall inventory is here. With properties taking an average of 45 to 48 days to sell and sale-to-list price ratios holding near 98%, you have time to perform due diligence, negotiate terms, and explore mortgage structure options without pressure.
For Sellers: Buyers are active but price-sensitive. Proper presentation, aggressive market positioning, and realistic pricing strategies are key to standing out among the expanding fall competition.
Have questions about what these numbers mean for your neighbourhood or specific street? Contact our team today for a tailored evaluation of your home!


Comments:
Post Your Comment: