RSS

The GTA Housing Market This October: What’s Actually Happening?

October brought a subtle shift across the Greater Toronto Area. While persistent economic uncertainty, high fixed mortgage rates, and the Bank of Canada’s recent 25-basis-point rate hike to 2.50% kept a chunk of prospective buyers cautious, the real story this fall is happening on the supply side.

New listings dropped by 11.9% year-over-year (and down 14.1% month-over-month), steadily draining active inventory. This pullback in supply prevented standing inventory from flooding the market and helped firm up average selling prices across the region compared to late summer.

October at a Glance: The Key Numbers (All TRREB Areas)

  • Average Selling Price: $1,024,108 (-2.7% YoY | +1.8% MoM)

  • Total Sales: 5,603 (-7.9% YoY | +11.2% MoM)

  • New Listings: 14,173 (-11.9% YoY | -14.1% MoM)

  • Active Listings: 25,098 (-10.0% YoY | -4.0% MoM)

  • Average Time on Market: 31 Listing Days (LDOM) / 49 Property Days (PDOM)

  • Average Sale-to-List Price Ratio: 97%

  • Months of Inventory: 4.48 Months (Balanced Market)

Macro Economic & Rate Context

  • Bank of Canada Move: On October 28, the Bank of Canada bumped its overnight rate up by 25 bps to 2.50%, pushing prime rates to 4.50% and lowest variable mortgage rates to around 3.70%.

  • Fixed Mortgage Rates: Tracked stickier government bond yields, holding firm in the 5.49% to 6.19% range.

  • Inflation & Growth: The rate bump was triggered by core inflation sitting at 3.1% in September and strong Q2 GDP growth (3.3%), signaling that policy rate cuts remain on pause for now.

  • Consumer Sentiment: Trade tensions and employment uncertainty continued to induce buyer hesitation, though lower selling prices compared to 2023/2024 peak levels have helped keep monthly mortgage payments manageable.

Property Type Breakdown across TRREB

  • Detached Homes: Recorded 2,693 sales (-6.2% YoY) with an average price of $1,310,627 (-3.2% YoY).

  • Semi-Detached Homes: Totaled 546 sales (-8.1% YoY) with an average selling price of $1,024,907 (-0.8% YoY).

  • Townhouses: Posted 508 sales (-11.0% YoY) at an average price of $905,385 (-5.0% YoY).

  • Condo Apartments: Saw 1,385 sales (-10.4% YoY) with an average selling price of $621,400 (-5.8% YoY).

Inside the Regions: Toronto vs. Durham Region

City of Toronto (416)

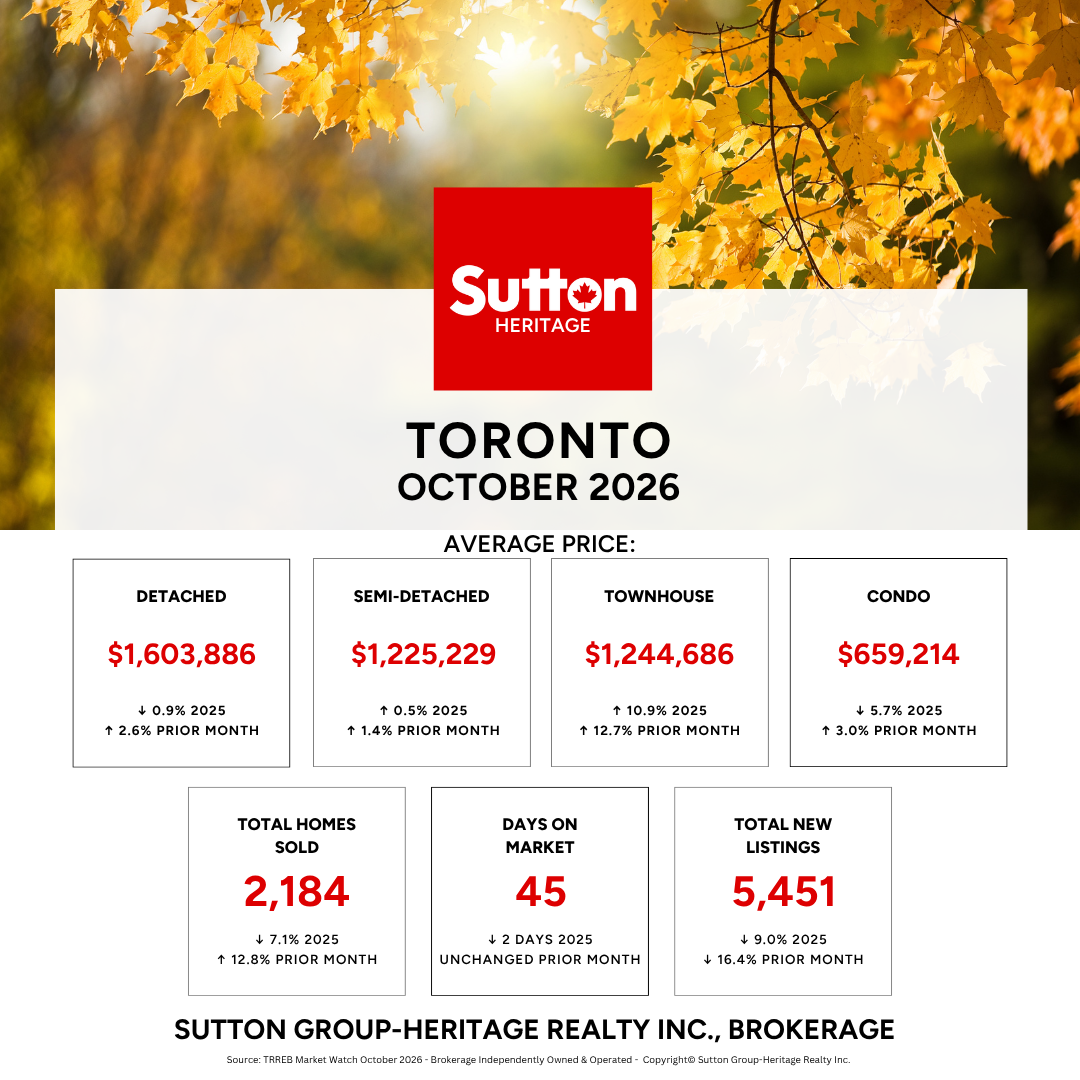
Toronto proper demonstrated strong month-over-month price momentum across almost all property types, bolstered by a sharp 16.4% drop in new listings MoM.

  • Total Sales: 2,184 (-7.1% YoY | +12.8% MoM)

  • Average Price: $1,075,627

  • Detached: $1,603,886 (-0.9% YoY | +2.6% MoM)

  • Semi-Detached: $1,225,229 (+0.5% YoY | +1.4% MoM)

  • Townhouse: $1,244,686 (+10.9% YoY | +12.7% MoM) — The standout performer in the 416 core.

  • Condo Apartment: $659,214 (-5.7% YoY | +3.0% MoM)

  • Days on Market: 45 Property Days

Durham Region (905)

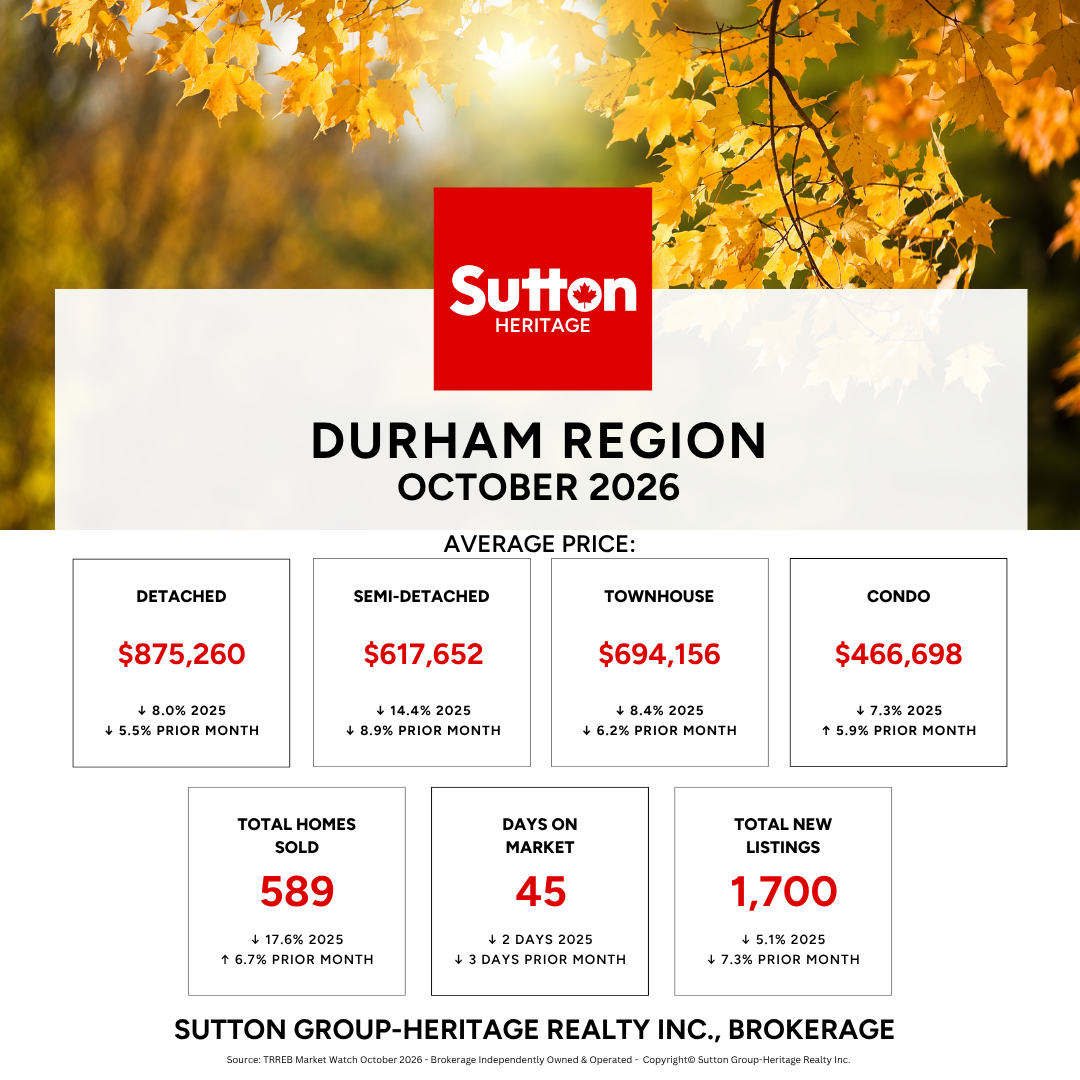
Durham Region offered accessible pricing points for buyers, though freehold values experienced modest softening month-over-month.

  • Total Sales: 589 (-17.6% YoY | +6.7% MoM)

  • Average Price: $793,024

  • Detached: $875,260 (-8.0% YoY | -5.5% MoM)

  • Semi-Detached: $617,652 (-14.4% YoY | -8.9% MoM)

  • Townhouse: $694,156 (-8.4% YoY | -6.2% MoM)

  • Condo Apartment: $466,698 (-7.3% YoY | +5.9% MoM)

  • Days on Market: 45 Property Days

What Does This Mean for You Heading Into Year-End?

For Buyers: Substantial Negotiating Power

  • Leverage in Negotiations: With average sale-to-list price ratios holding at 97%–98% and homes averaging 45 to 49 property days on market, buyers have room to include conditions and negotiate terms.

  • Price Floor Stability: Active inventory is down 10% year-over-year, meaning prices are stabilizing rather than plummeting. If you're waiting for a drastic price crash before entering the market, current inventory trends suggest prices are holding steady.

For Sellers: Strategic Pricing is Essential

  • Compete on Presentation & Price: Shrinking active inventory provides support against steep price drops, but elevated days on market mean buyers are taking their time.

  • Realistic Alignment: Properties priced at current fair market value are moving smoothly, whereas over-priced listings are sitting and requiring price adjustments.

Looking Ahead to Q4

As we move toward the final weeks of 2026, the GTA market is settling into a balanced state. Supply contraction is keeping prices grounded around the $1.00M–$1.02M mark, while elevated mortgage rates prevent a sudden surge in buyer frenzy. Expect steady, measured activity heading into the winter months.

Need Strategy, Not Guesswork?

Whether you’re planning your next move in Toronto, Durham Region, or across the GTA, having a localized strategy makes all the difference. Reach out today for a personalized consultation!


Get the complete view on markets in Durham, Markham/Stouffville and Port Hope/Cobourg.

Read

Ring in the Holidays: Your 2026 Guide to Santa Claus Parades in Toronto and the Durham Region!

Top Santa Claus Parades to Ring in the Holidays in Durham Region

The holiday season is nearly here, and the best way to kick off the festive spirit is with a classic Santa Claus parade! The Durham Region and Greater Toronto Area (GTA) are gearing up for a spectacular lineup of parades, perfect for community members of all ages. These beloved traditions unite our neighbourhoods with stunning floats, seasonal music, bright lights, and, of course, a magical appearance from Santa himself.

Let’s dive into the updated schedule. All dates, times, and locations below are adjusted for the 2026 parade season.

1. Bowmanville Santa Claus Parade

  • Date: Saturday, November 14, 2026

  • Time: 10:30 a.m.

  • Location: King Street, Bowmanville, ON

Start your holiday season with Bowmanville’s cherished morning event. This parade is famous for its small-town charm and community involvement. It’s a bright and cheerful way to kick off the weekend!

2. Uxbridge Santa Claus Parade

  • Date: Saturday, November 14, 2026

  • Time: 11:00 a.m.

  • Location: Brock Street, Uxbridge, ON

Just after the Bowmanville parade starts, head over to Uxbridge for a great day of festive fun. Attendees can participate by voting for their favourite float entry to win the "People's Choice Award."

3. Oshawa Santa Claus Parade of Lights

  • Date: Saturday, November 21, 2026

  • Time: 6:00 p.m.

  • Location: Bond Street West, Downtown Oshawa, ON

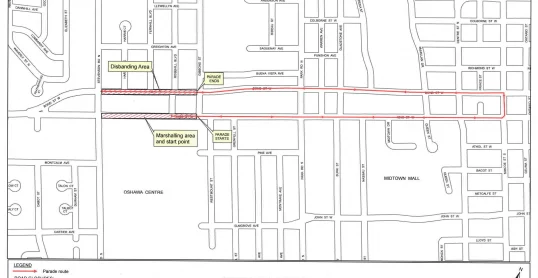
Experience the true magic of the season at this enchanting evening event. Downtown Oshawa is illuminated by sparkling floats and vibrant performances, making this nighttime tradition a dazzling spectacle. The parade route begins at Division Street and travels west along Bond Street.

4. Newcastle Santa Parade

  • Date: Sunday, November 15, 2026

  • Time: 5:30 p.m.

  • Location: Downtown Newcastle, ON

Join the Village of Newcastle for a magical evening parade. The night features dazzling lights, marching bands, and a festive procession. Keep an eye out for this year’s local theme as the floats line up along King Street!

5. Pickering Santa Claus Parade

  • Date: Saturday, November 21, 2026

  • Time: 10:00 a.m.

  • Location: Starts at Dixie Road and Glenanna Road, Pickering, ON

Gather your family and friends for this popular morning spectacle! The parade features extravagant floats from Pickering businesses and community groups. This year’s theme is "Holiday Movie Magic."

6. Santa's Spectacle of Lights – Ajax Santa Claus Parade

  • Date: Saturday, November 21, 2026

  • Time: 6:00 p.m.

  • Location: Bayly Street and Harwood Avenue South, Ajax, ON

Join the bright, festive glow at Ajax’s annual Spectacle of Lights. The route will be packed with illuminated floats, marching bands, and local entertainers. After the parade, stick around for the annual tree lighting ceremony and community celebrations at Town Hall.

7. Orono Santa Claus Parade

  • Date: Saturday, November 28, 2026

  • Time: 10:30 a.m.

  • Location: Main Street, Orono, ON

Celebrate the return of the Orono parade! This event is a great stop before heading to afternoon festivities. Don’t miss the local markets and festive fun happening downtown following the procession.

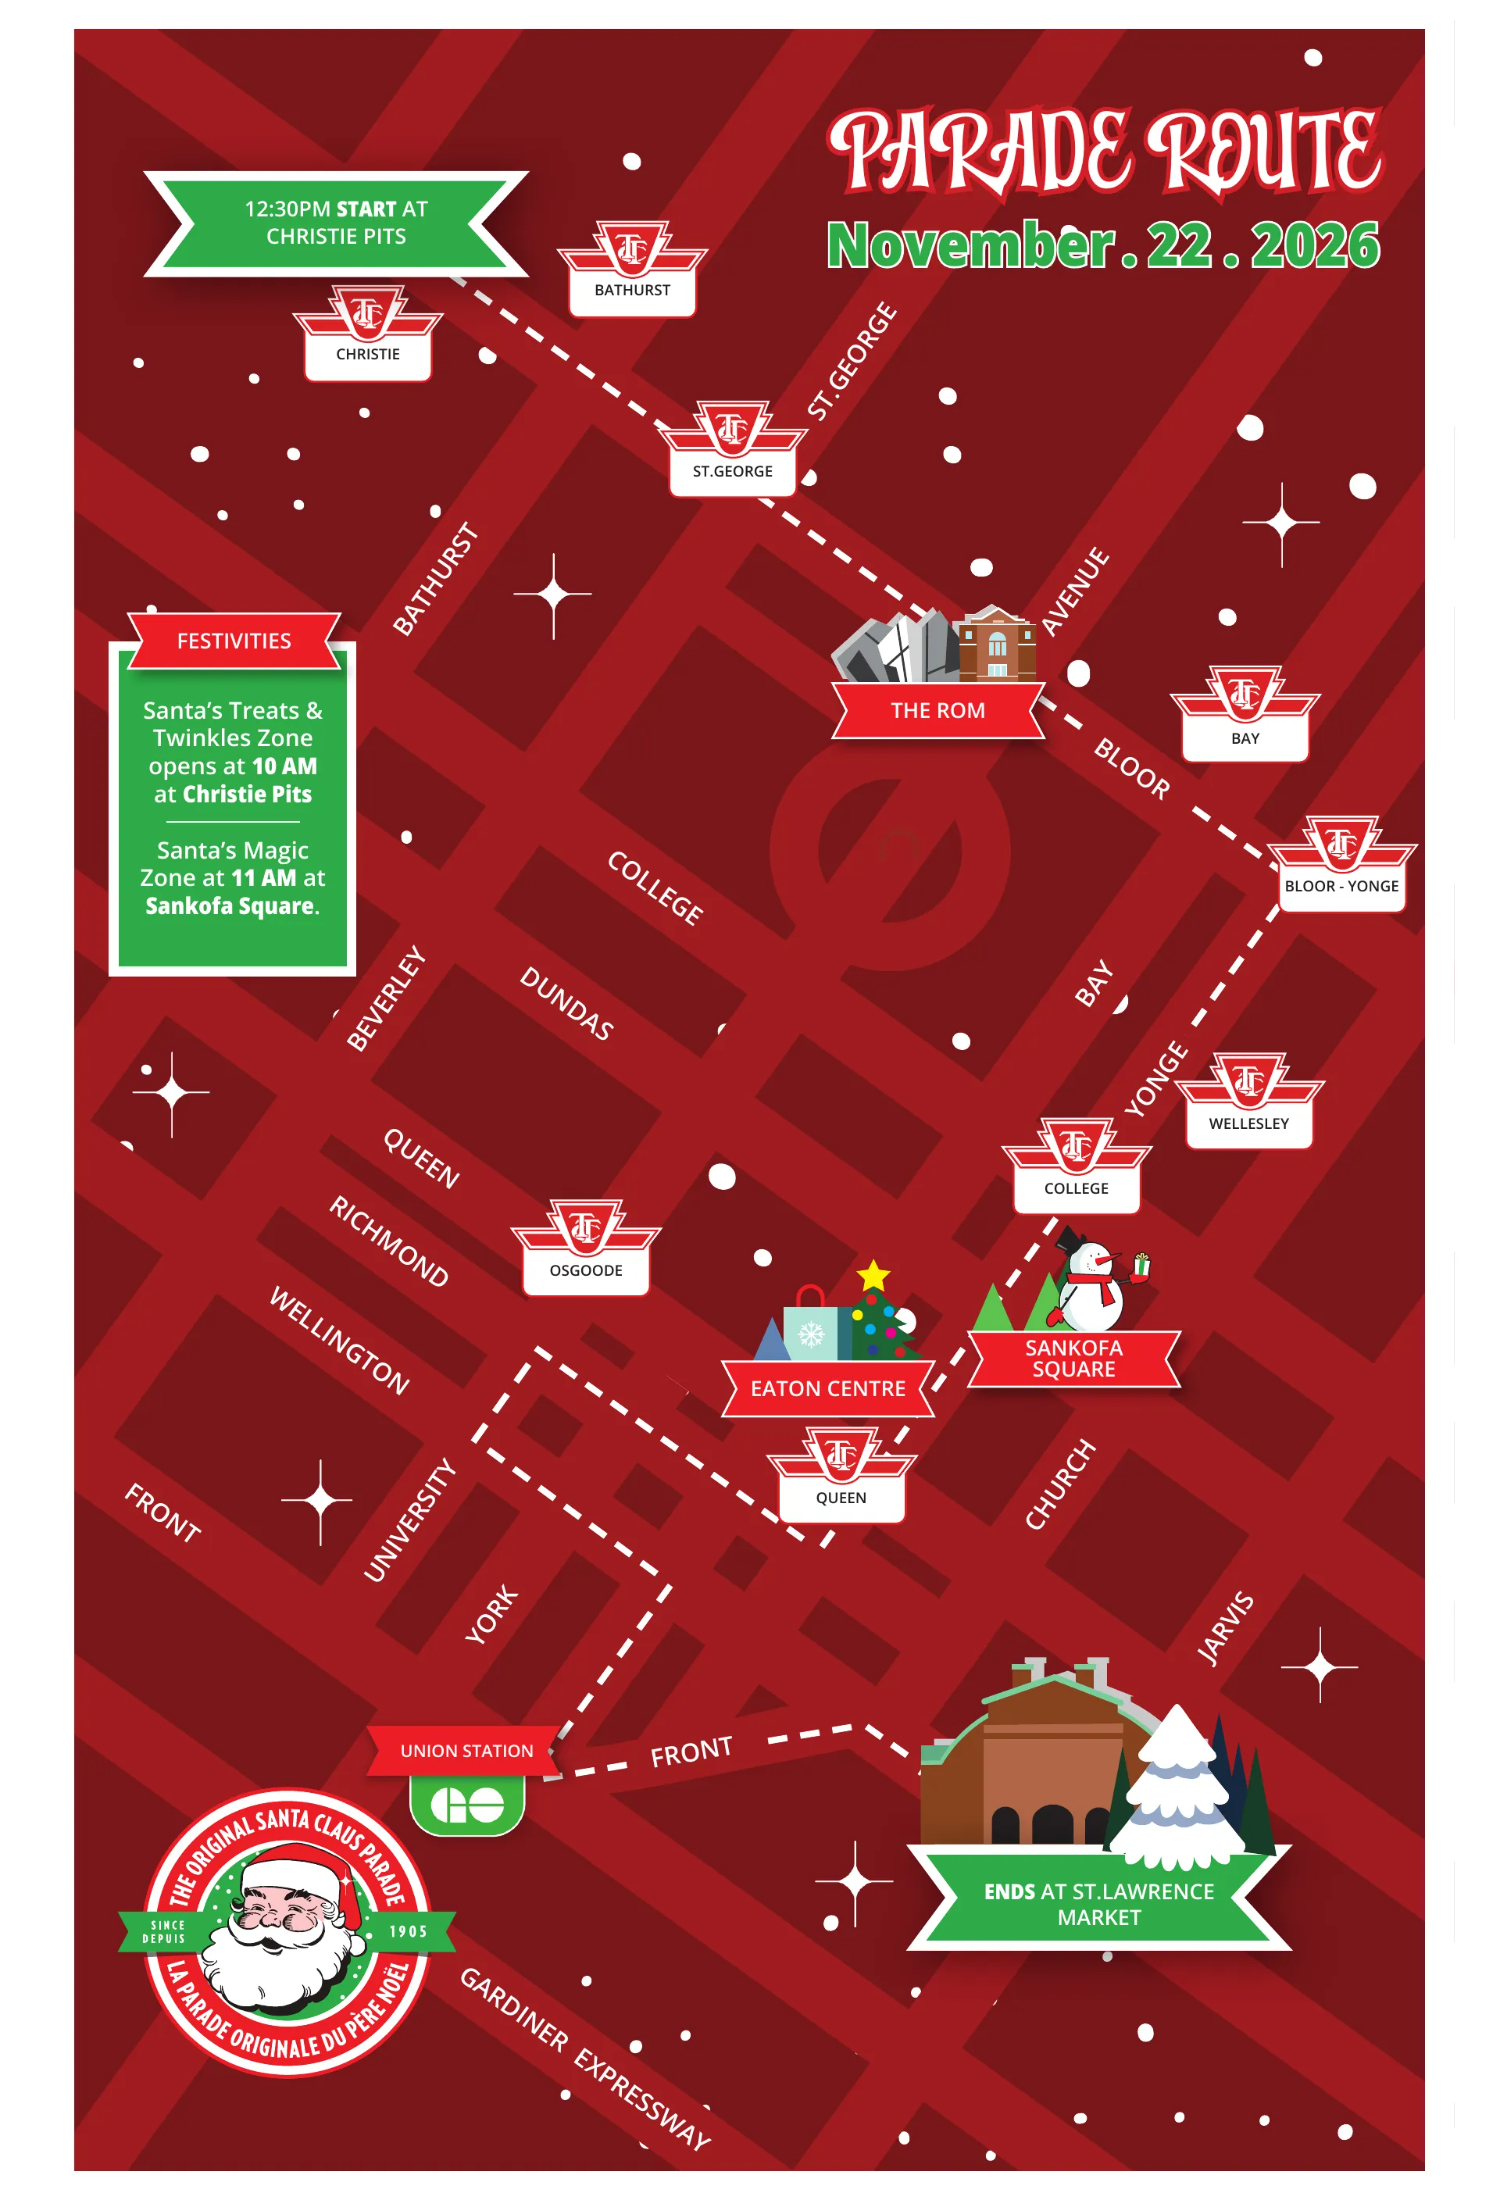
8. The Original Santa Claus Parade – Toronto

  • Date: Sunday, November 22, 2026

  • Time: 12:30 p.m.

  • Location: Starts at Christie Pits (750 Bloor Street West) and ends near St. Lawrence Market, Toronto, ON

Don’t miss Toronto’s world-famous parade! A tradition for over a century, this massive event brings spectacular floats, marching bands, and Celebrity Clowns to the heart of the city.

9. Cannington Lions Santa Claus Parade

  • Date: Saturday, November 28, 2026

  • Time: 11:00 a.m.

  • Location: Cameron Street, Cannington, ON

Mark your calendar for this wonderful weekend morning parade! After seeing the festive floats make their way through town, kids can visit Santa at the Cannington Fire Hall.

10. Beaverton Lions Santa Claus Parade

  • Date: Saturday, November 28, 2026

  • Time: 6:00 p.m.

  • Location: Starts at the Beaverton Fair Grounds, traveling along Main Street, Simcoe Street, Osborne Street, and Bay Street.

Make an evening of it! The parade is preceded by the annual Christmas Open House at downtown stores. Following the parade, kids can enjoy a visit with Santa at the Beaverton Fire Hall.

11. THEE Farmers' Parade of Lights

  • Date: Wednesday, December 2, 2026

  • Time: 5:30 p.m.

  • Location: Old Scugog Rd & Concession 9, Clarington, ON (Parade travels through Tyrone, Haydon, Enniskillen, and Enfield)

This unique nighttime celebration travels through Clarington’s scenic countryside. Enjoy a fantastic display of lights as decorated tractors, trucks, and floats move through the rural communities. Guests are encouraged to bring a non-perishable food item for the local food drive.

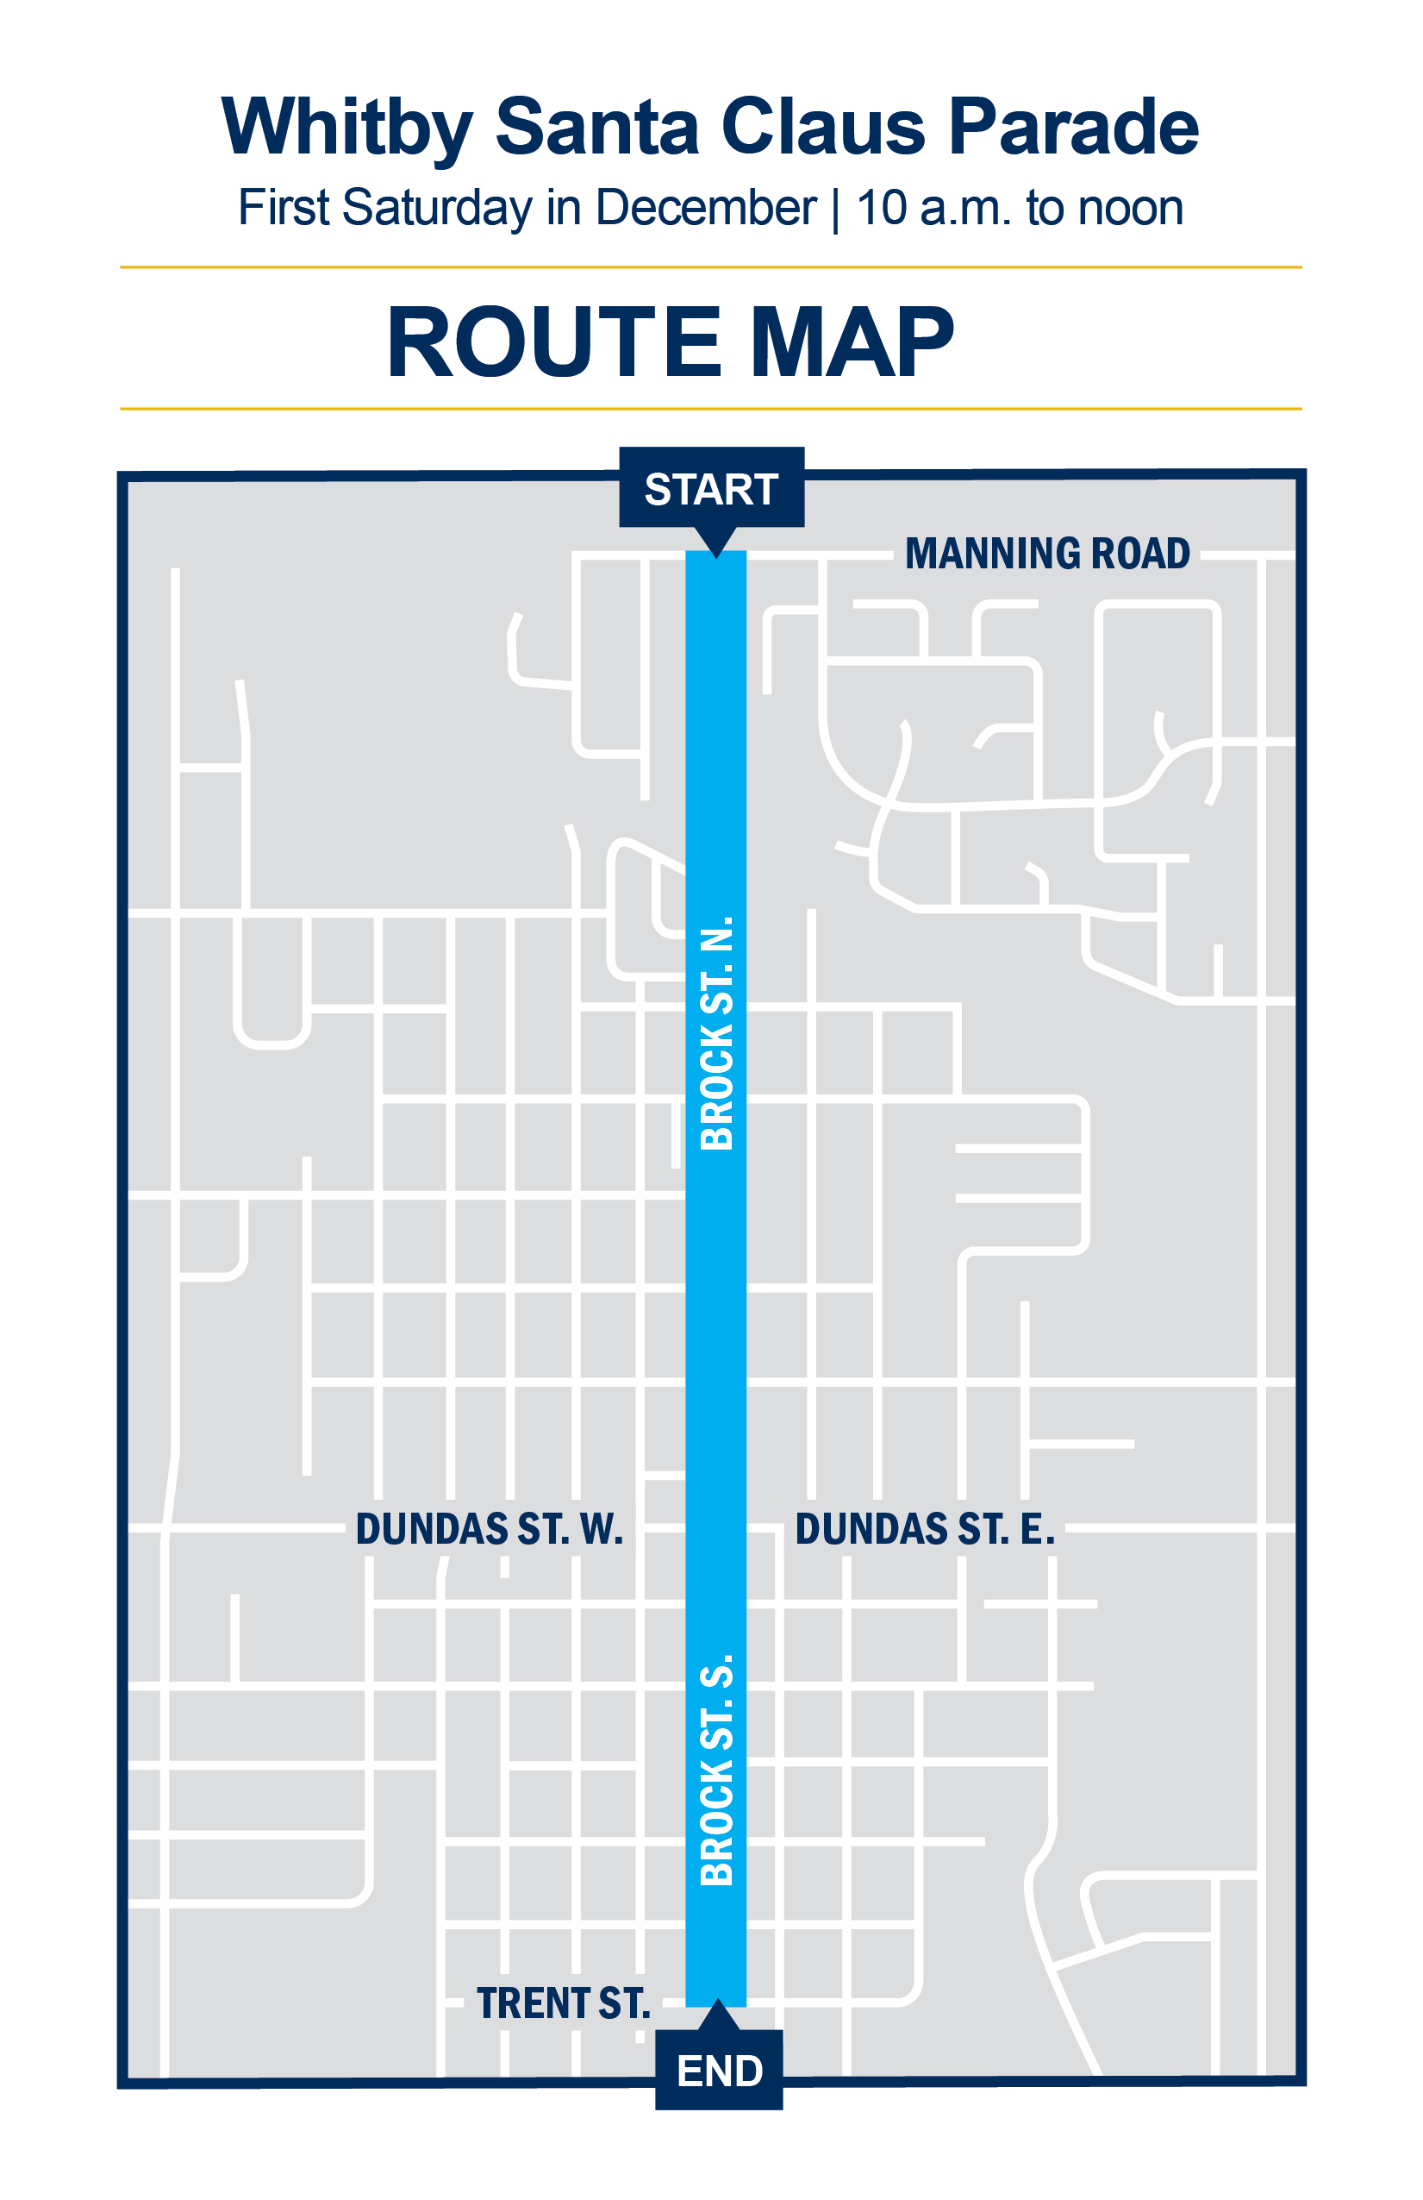
12. Whitby Santa Claus Parade

  • Date: Saturday, December 5, 2026

  • Time: 10:00 a.m.

  • Location: Brock Street North, Whitby, ON

A long-standing tradition for over 50 years, Whitby’s morning parade brings holiday cheer with beautifully decorated floats and music. It’s a wonderful community event and a perfect way to start your weekend.

13. Scugog Santa Claus Parade — Port Perry

  • Date: Saturday, December 5, 2026

  • Time: 5:00 p.m.

  • Location: Port Perry Fair Grounds to Palmer Park, Port Perry, ON

End your day with the enchantment of the Scugog parade! This unforgettable evening event features dozens of floats, vibrant marching bands, and a special appearance by Santa along Queen Street.

14. Courtice Santa Claus Parade

  • Date: Sunday, December 6, 2026

  • Time: 12:00 p.m. (Noon)

  • Location: Nash Road, Courtice, ON

Enjoy the festive atmosphere with creative floats and performances. Gather your loved ones for this afternoon celebration filled with community spirit and holiday joy.

15. Sunderland Santa Claus Parade

  • Date: Saturday, December 12, 2026

  • Time: 7:00 p.m.

  • Location: Starts at the Sunderland Brock Memorial Arena (20 Park Street, Sunderland)

This evening parade is a great way to enjoy some late-season holiday fun! Guests are encouraged to bring a bag for collecting candy as Santa travels through the streets of Sunderland.

Parade Day Tips

Preparing for a Santa Claus parade is all about staying comfortable and making the most of this festive experience. Here are some tips to help you enjoy the event to the fullest:

  • Dress for the Weather: Durham Region can be chilly in the winter months, so bundle up in layers, hats, scarves, and gloves to stay warm.

  • Bring Seating: Pack blankets or portable lawn chairs to secure a cozy spot along the parade route.

  • Support Local Charities: Many parades welcome non-perishable food donations and toys. Consider bringing items to share the holiday spirit and support those in need.

  • Don't Forget Santa's Mail: If your kids have letters for Santa, bring them along! Canada Post mail carriers walk along many of these routes collecting letters.

  • Pack Snacks and Warm Drinks: To keep everyone comfortable, bring along hot chocolate, coffee, and easy-to-carry snacks.

Enjoy the Festivities

So, whether you're in Toronto or the Durham Region, these Santa Claus parades are sure to get you into the holiday spirit. Bundle up, gather your loved ones, and head out to enjoy the festive floats, holiday music, and the magic of Santa himself. Make this holiday season unforgettable!

Read

Durham Region Remembrance Day Events: Honoring Our Heroes

Gathering in Honor: A Guide to Remembrance Day Ceremonies Across Durham Region

UPDATED for 2026: Durham Region Remembrance Day Events 2026: Honoring Our Heroes

Every year on November 11th, communities across Durham Region gather to observe a moment of silence at 11:00 a.m. and honor the brave men and women who have served and sacrificed for our freedom.

If you are looking to pay your respects locally, here is a guide to the 2026 Remembrance Day parades, services, and ceremonies happening across Oshawa, Whitby, Ajax, Pickering, and Clarington.

Oshawa

  • Location: Memorial Park (110 Simcoe St. S, Oshawa)

  • Parade Starts: 10:25 a.m. (marching from the Armoury/RCSCC Sir Francis Drake to Memorial Park)

  • Ceremony Starts: 10:45 a.m.

  • Details: Hosted in coordination with the Royal Canadian Legion (Branch 43), the parade leads into a full wreath-laying ceremony at the cenotaph, followed by the two-minute silence at 11:00 a.m.

Whitby

  • Location: Whitby Cenotaph (Dundas St. E & Centre St. S)

  • Parade Starts: 10:30 a.m. (marching down Dundas St. from the Royal Canadian Legion Branch 112)

  • Ceremony Starts: 10:45 a.m.

  • Details: The service includes laying of official wreaths, poetry recitations, and local cadet formations. Note: Dundas Street surrounding the cenotaph will be closed to vehicle traffic during the service.

Ajax

  • Location: Legion Park Cenotaph (4 Hunt St, Ajax)

  • Ceremony Starts: 10:45 a.m.

  • Details: Presented by Royal Canadian Legion Branch 322, this annual service honors veterans and active military personnel with standard wreath presentations and a parade formation.

Pickering

  • Location: Pickering City Hall – Main Council Chambers / Esplanade Park Cenotaph (1 The Esplanade, Pickering)

  • Ceremony Starts: 10:45 a.m.

  • Details: Hosted by the Royal Canadian Legion Branch 606, community members gather at the Esplanade Park Cenotaph for the service and wreath-laying. In the event of extreme inclement weather, proceedings shift indoors to the City Hall Council Chambers.

Clarington (Bowmanville & Newcastle)

  • Bowmanville Cenotaph (Town Hall Square, 40 Temperance St): Service begins at 10:45 a.m. organized by Legion Branch 178.

  • Newcastle Memorial Park (King St W): Morning service and parade at 10:30 a.m. organized by Legion Branch 178.

City of Toronto Civic Ceremonies

All official City of Toronto civic ceremonies begin at 10:45 a.m. on Wednesday, November 11:

  • Old City Hall Cenotaph (Downtown): 60 Queen St. W. (Major road restrictions on Bay St. and Queen St. W. near the cenotaph).

  • North York Cenotaph / York Cemetery: 160 Beecroft Rd.

  • Scarborough War Memorial: 2190 Kingston Rd.

  • Etobicoke Civic Centre Cenotaph: 399 The West Mall.

  • East York Civic Centre Memorial Gardens: 850 Coxwell Ave.

  • Fort York National Historic Site (Garrison Common): 100 Garrison Rd.

  • York Civic Centre Cenotaph: 2700 Eglinton Ave. W.

Tips for Attending Local Ceremonies

  1. Arrive Early: Parking near downtown cenotaphs (especially in Oshawa and Whitby) fills up quickly due to road closures. Plan to arrive by 10:15 a.m.

  2. Dress for the Weather: All primary ceremonies take place outdoors, rain or shine.

  3. Get Your Poppy: Support your local Royal Canadian Legion branch by purchasing a poppy from local campaign tables prior to November 11.

Take a moment this Remembrance Day to honour those who served and continue to serve. Together, let's remember and reflect on the courage and dedication of our veterans and active service members.

Read

The GTA Housing Market This September: What's Actually Happening?

If you’ve been watching the Toronto and Durham real estate markets, you might be wondering why the news feels full of mixed signals. Headline numbers talk about sales dipping, while on the ground, buyers and sellers are navigating a market shaped by changing mortgage dynamics, seasonal inventory surges, and economic holding patterns.

Let's break down what actually happened across the Greater Toronto Area, Toronto, and Durham Region in September 2026, and what it means for your next move.

The Big Picture across the GTA

Across the entire Toronto Regional Real Estate Board (TRREB) area, September showed a market where buyers remained cautious amidst borrowing cost uncertainty, while sellers adjusted to early autumn expectations:

  • Total Sales: 5,040 (-9.0% YoY)

  • Average Selling Price: $1,006,409 (-5.1% YoY)

  • New Listings: 16,500 (-14.4% YoY)

  • Active Listings: 26,131 (-9.3% YoY)

  • Days on Market (Avg. LDOM): 34 days

  • Property Days on Market (Avg. PDOM): 51 days

  • Sales-to-List Price Ratio: 98%

While overall sales slowed compared to last September, supply also contracted, keeping inventory from over-accumulating and keeping negotiation room grounded around 98% of list price.

City of Toronto Market Breakdown

Toronto saw a classic post-Labour Day influx of new listings alongside a notable uptick in month-over-month sales activity.

Key Toronto Insights

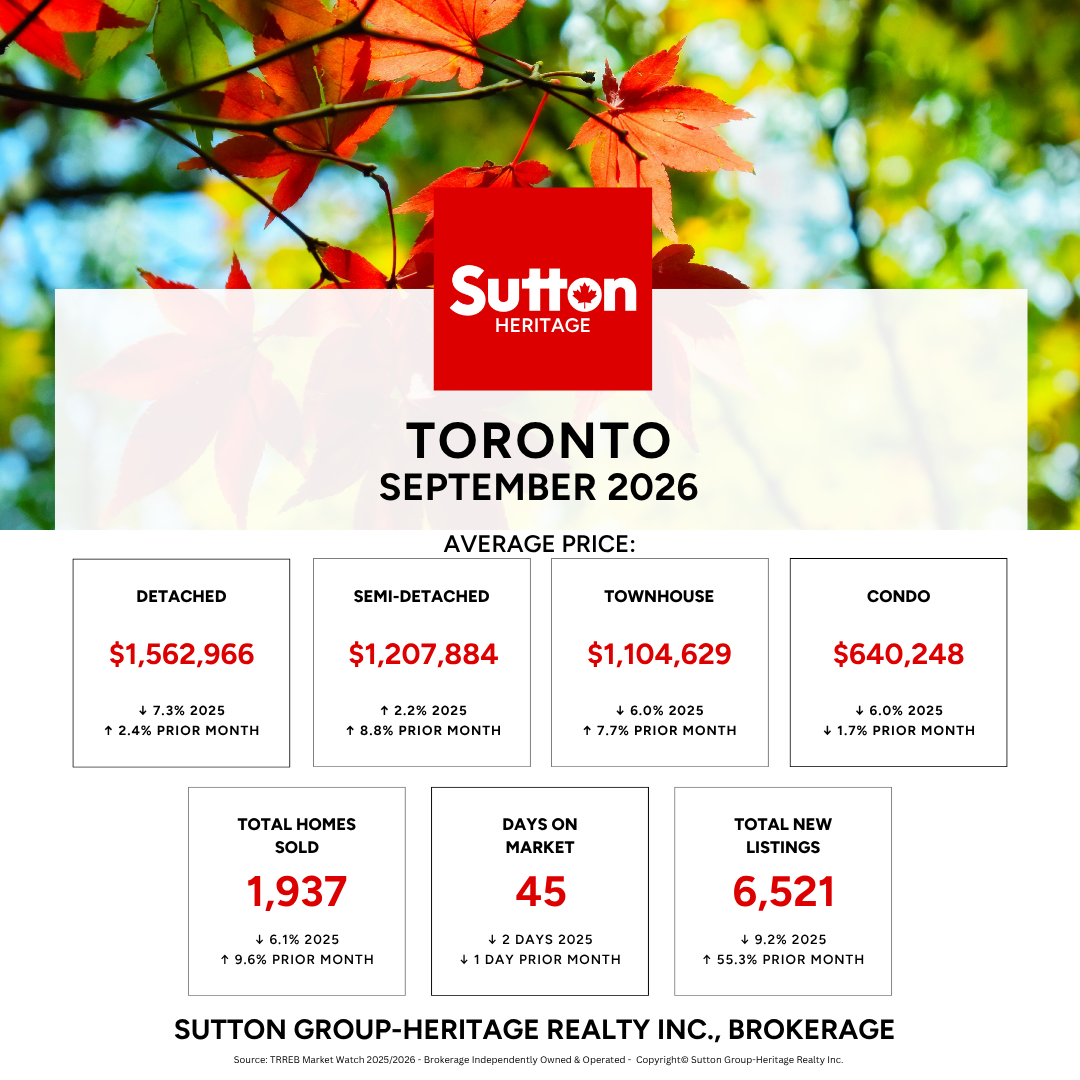
  • Freehold Demand Bounced Back Month-over-Month: Semi-detached homes ($1,207,884) and townhouses ($1,104,629) posted strong month-over-month price growth of +8.8% and +7.7% respectively, demonstrating sustained buyer demand for mid-tier freehold options.

  • Fall Inventory Arrived: New listings surged +55.3% from August to 6,521 homes, offering buyers significantly more choice than in the summer months.

  • Condos Remain Soft: Condo average prices dipped slightly month-over-month (-1.7%) to $640,248 as higher inventory levels in the condo sector gave buyers the upper hand during negotiations.

Durham Region Market Breakdown

Durham Region continued to offer an appealing blend of relative affordability and community appeal, though seasonal shifts were clearly evident.

Key Durham Insights

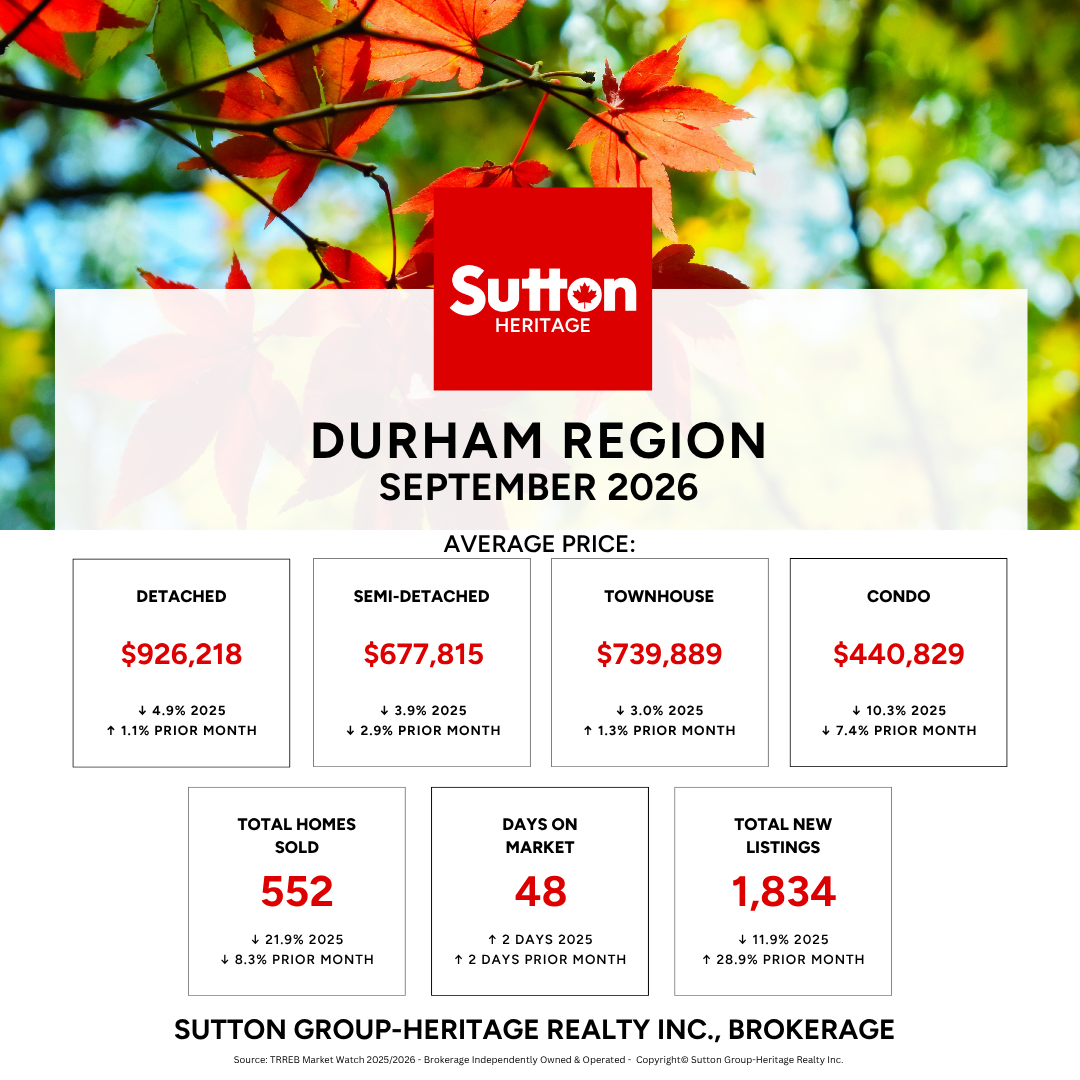
  • Detached & Townhouse Resilience: Single-family detached homes ($926,218) and townhouses ($739,889) both saw modest price increases month-over-month (+1.1% and +1.3%), reflecting steady family-home demand across Ajax, Whitby, Oshawa, and Pickering.

  • Slower Pace of Sales: Total sales dropped -8.3% month-over-month to 552 units, while Days on Market ticked up to 48 days, giving buyers extra room to inspect properties and finalize financing without feeling rushed.

  • Condo Opportunity: Condo apartment prices in Durham dropped to $440,829 (-7.4% MoM), creating an accessible entry point for first-time buyers looking to get onto the property ladder.

Behind the Numbers: Interest Rates & Mortgage Dynamics

Heading into October, borrowing dynamics played a major role in buyer behavior:

  1. The Fixed vs. Variable Gap: While the Bank of Canada held its overnight policy rate steady at 2.25% in its early September announcement, 5-year fixed mortgage rates edged upward due to rising bond yields. Variable rate options remained lower, creating a wider-than-usual rate spread and forcing buyers to choose between fixed stability or lower initial variable payments.

  2. Pent-Up Demand in a Holding Pattern: Many prospective buyers are sitting on pre-approvals, waiting for inflation trends and rate expectations to settle before locking into longer-term financing.

  3. Strategic Pricing Matters: With new listings up significantly from August (+55.3% in Toronto, +28.9% in Durham), sellers who price accurately based on recent local comps are securing firm sales, while over-priced listings are sitting past the 40-to-50-day mark.

What This Means for You

  • For Buyers: Fall inventory is here. With properties taking an average of 45 to 48 days to sell and sale-to-list price ratios holding near 98%, you have time to perform due diligence, negotiate terms, and explore mortgage structure options without pressure.

  • For Sellers: Buyers are active but price-sensitive. Proper presentation, aggressive market positioning, and realistic pricing strategies are key to standing out among the expanding fall competition.

Have questions about what these numbers mean for your neighbourhood or specific street? Contact our team today for a tailored evaluation of your home!

Read

The GTA Housing Market This August: What's Actually Happening?

August brought a noticeable shift across the Greater Toronto Area as supply contracted faster than buyer demand. With new listings pulling back significantly, inventory levels are tightening across key submarkets. This shrinking pool of active options is stabilizing property values and setting up a more competitive environment heading into the fall season.

August at a Glance: The Key Numbers

  • GTA Average Price: $993,410 (-2.7% year-over-year)

  • Sales: 5,057 (-2.1% year-over-year)

  • New Listings: 12,075 (-14.1% year-over-year)

  • Active Listings: 24,482 (-11.3% year-over-year)

  • Average Days on Market: 35 (LDOM) / 51 (PDOM)

  • Average Sale-to-List Price Ratio: 97%–98%

  • With 5 months of inventory we’re on the edge of a buyers market.

What Actually Happened

Home sales activity pulled back moderately in August, down 2.1% compared to August 2025 as late-summer seasonality slowed the absolute volume of deals. Price erosion continued to flatten, with the GTA-wide average selling price off by just 2.7% year-over-year.

While year-over-year prices declined for the 8th consecutive month that decline is slowing. The primary driver shaping current conditions is the sharper pullback in inventory. New supply coming to market contracted by 14.1% year-over-year, alongside an 11.3% drop in active listings. Rather than inventory building up and pressuring prices further, fewer homeowners choosing to list has constrained buyer selection. This tightening supply footprint is insulating property values from significant declines.

What Industry Experts & Online Analysts Are Saying Right Now

  • The TRREB / Optimist Take: Board analysts argue that shrinking new supply, combined with lower interest rates and flat benchmark pricing on a month-over-month basis, will soon create localized inventory shortages. They suggest this setup could trigger a price floor and push cautious buyers off the sidelines before prices rebound.

  • The Bearish / Skeptical View: Many market commentators on forums like Reddit (r/TorontoRealEstate) and independent market observers focus heavily on overall active inventory levels and days on market. They highlight that total unsold supply remains near multi-year highs (particularly in the condo segment), while macro concerns—such as job market uncertainty and trade policy—are preventing pent-up buyer demand from actually materializing into offers.

  • The Consensus Going Into Fall: Most agents and analysts agree that August was a seasonal lull, making it a poor gauge for the rest of the year. The upcoming "fall surge" (mid-September through October) will reveal whether sellers flood the market with fresh inventory or if supply stays tight enough to stabilize prices.

What's happening locally? Durham Region & Toronto Insights

Inside the Regions & Property Types

Market conditions diverged depending on property style and location across the Greater Toronto Area:

  • Detached Homes: Reached 2,399 sales (+0.5% YoY) with an average price of $1,288,669 (-1.8% YoY). City of Toronto (416) detached properties averaged $1,525,749 across 550 sales, while the 905 region posted 905 sales averaging $1,218,148.

  • Semi-Detached Homes: Totaled 439 sales (+0.9% YoY) at an average selling price of $931,665 (-5.0% YoY).

  • Townhomes: Saw 832 sales (-9.5% YoY) with the average selling price coming in at $786,817 (-8.6% YoY).

  • Condominium Apartments: Posted 1,330 sales (-2.6% YoY) with an average price of $617,593 (-3.6% YoY). Toronto (416) condos accounted for 885 of those sales at an average of $651,648.

  • Durham Region (905 Submarket): Showed tighter inventory absorption than the broader GTA, posting 602 sales at an average price of $819,569, average days on market of 31, and a list-to-sale ratio of 98%.

What This Means for Buyers and Sellers

  • If you are thinking of selling: The pool of competing active listings is contracting. Heading into the autumn market, reduced inventory competition gives properly prepared and realistically priced properties strong positioning to capture serious buyer interest.

  • If you are thinking of buying: Benchmark prices show signs of stabilizing, but fewer new options are entering the market each week. While discount room is narrower on turnkey properties, current interest rates offer opportunities to lock in competitive borrowing terms.

  • Strategy matters: Overpricing remains non-viable as buyers remain value-conscious, but well-presented homes in desirable pockets continue to move efficiently.

The key thing to watch will be inventory as we head into the fall market. It’s reasonable to suspect more inventory will come online. How much and whether the buyers match that inventory will be the key thing to watch in the coming month.

Final Word

Whether you are planning to make a move this season or simply keeping an eye on your local equity, generic headline averages rarely tell the full story of what your specific home is worth. Local supply shifts, neighborhood demand, and home style all play a massive role in setting accurate market value today. Reach out today for a complimentary, no-obligation valuation to discover exactly what your home is worth in current market conditions.

Read

The GTA Housing Market This July: What's Actually Happening?

If you've been scanning the latest real estate headlines, it's easy to feel like you're getting mixed messages. One news outlet says the market is cooling, while another claims conditions are tightening. So, what’s actually happening on the ground across the Greater Toronto Area (GTA) as we head into the second half of summer?

Rather than dramatic shifts in either direction, July delivered a market that is steadily normalizing. While total home sales took a minor pause year-over-year, the bigger story is on the supply side: new listings dropped significantly, which means active inventory is shrinking and buyer competition is quietly firming up in high-demand pockets.

July at a Glance: The Key Numbers

Here is how the stats broke down across the GTA compared to July of last year:

  • Total Sales: 5,995 homes sold, down slightly by 0.9% from 6,047.

  • Average Selling Price: $1,003,956, down 4.5% year-over-year from $1,051,600.

  • New Listings: 14,484, a sharp decline of 17.8% compared to last year's listing surge.

  • Active Listings: 26,098, down 12.1%, showing that overall standing inventory is being steadily absorbed.

  • Average Time on Market: 32 listing days (45 property days overall), giving buyers and sellers a more measured pace than the frenzied peaks of previous years.

On a seasonally adjusted month-over-month basis, home sales actually edged higher while new inventory continued to slow. Fewer new options arriving each week meant buyers had slightly less leverage to negotiate aggressively than they did earlier this spring.

How Different Home Types Are Performing

Not all segments of the housing market are moving at the same pace. The freehold low-rise market—particularly detached homes—showed stronger buyer demand, whereas semi-detached homes and townhouses saw a modest pullback in transaction volume.

  • Detached Homes: Sales rose 0.6% year-over-year to 2,789 transactions, with an average price of $1,291,690 (-5.1% YoY).

  • Semi-Detached Homes: Sales dropped 5.9% to 557 transactions, averaging $964,922 (-7.4% YoY).

  • Townhouses: Sales fell 2.7% to 1,003 transactions, with an average price of $817,213 (-3.9% YoY).

  • Condo Apartments: Sales remained essentially flat (-0.1%) at 1,564 transactions, holding an average price of $636,323 (-2.3% YoY).

A Local Look: Durham Region

In Durham Region, market activity remained brisk compared to the wider GTA average. Durham recorded 725 sales in July with an average selling price of $834,312. Properties here moved in an average of just 27 days, reflecting solid demand for more accessible price points outside the Toronto core.

What This Means for Buyers and Sellers

For Buyers: Less Choice, But More Price Stability

The flood of new listings that defined late 2024 and 2025 has receded back to historic norms. With new listings down nearly 18%, you won't see dozens of brand-new properties hitting your search alerts every morning. While prices are lower compared to last summer, well-priced homes in desirable locations are no longer sitting idle. If you're waiting for a massive price drop, the shrinking inventory suggests prices are stabilizing rather than plummeting.

For Sellers: Strategy & Pricing Are Everything

Sellers who expect 2021-era bidding wars overnight will need to adjust their strategy. Homes are taking just over a month on average to sell, so setting realistic, market-supported asking prices is essential. The good news? Shrinking active inventory means less competing supply on your street. If you present your home well and price it accurately, serious buyers are out there and active.

Final Word: A Stable, Balanced Landscape

The July market isn't a runaway boom, nor is it a downturn. Instead, it represents a calibrated, predictable environment where supply and demand are finding better equilibrium. As borrowing costs sit in a more manageable range and economic sentiment continues to clear, we expect buyer confidence to build steadily as we move toward the fall market.

Are you thinking about buying or selling in Durham Region or across the GTA heading into the fall? Reach out directly for a personalized breakdown of recent sales and active listings in your specific neighborhood.

Read

The GTA Housing Market This June: What’s Actually Happening?

If you’ve been watching the Toronto and Durham real estate markets lately, you’ve probably noticed the mixed signals. One headline says prices are down; another says competition is heating up. It’s enough to give anyone analysis paralysis.

Let’s cut through the noise. Here is what happened in June 2026 and—more importantly—what it actually means for your wallet, your family, and your next move.

The Big Picture: Sales Are Up, Options Are Down

The biggest takeaway from June is that more people are buying, but fewer people are putting their homes up for sale.

  • Sales jumped 9.4% compared to last June. People who were waiting on the sidelines are officially moving forward with their lives.

  • New listings dropped 12.9%. Sellers are holding back, meaning there are fewer homes on the market to choose from.

  • The average price sits at $1,058,658. While that is about 3.9% lower than last year, the price drop is slowing down because competition is starting to stiffen again.

Property Breakdown: Where is the Action?

Depending on what you are looking to buy or sell, the market feels very different right now. Get local stats for different home types in your market at the bottom of this post.

🏡 Detached Homes (The Family Move)

  • Average Price: $1,364,204 across the GTA.

  • The Vibe: Demand is steady (+9.1% in sales). If you are looking in the suburbs (905), the average is closer to $1,272,842. If you want to be in Toronto proper (416), expect an average of $1,648,440.

🏢 Condos (First-Time Buyers & Downsizers)

  • Average Price: $630,688.

  • The Vibe: Condo sales saw a huge 14.3% spike. Why? Because prices are down nearly 9.5% from last year, making them the most affordable entry point for first-time buyers and an attractive, equity-releasing option for downsizers.

🏘️ Townhomes & Semi-Detached (The Middle Ground)

  • The Vibe: These remain the "sweet spot" for growing families. Average townhomes are hovering around $844,579, while semis are at $1,038,973. They are moving steadily because they offer the backyard space of a detached home without the heavier price tag.

📍 Spotlight on Durham Region

For middle-class families looking for more square footage for their dollar, Durham continues to be a massive draw.

  • Average Price overall: $856,170

  • Oshawa remains one of the most accessible pockets with an average price of $726,544.

  • Ajax ($868,651) and Whitby ($936,392) offer great balance for commuters wanting a bit more suburban breathing room.

What Does This Mean for You?

If You Are Buying (First-Timers & Upsizers)

The "buyer's market" window is starting to narrow. Because new listings are dropping, you have less inventory to choose from than you did a few months ago. The Bank of Canada’s overnight rate is sitting at 2.25%, but fixed mortgage rates are still averaging in the mid-5% to low-6% range.

The Strategy: Don't try to perfectly time the absolute "bottom" of the market. Figure out what monthly payment you are comfortable with right now. If you find a home that fits your life and your budget, lock it in before inventory shrinks further.

If You Are Selling (Downsizers & Standard Movers)

You actually have a bit more leverage than you think. Because there are fewer homes competing with yours, serious buyers have fewer options. However, homes are taking a little longer to sell—averaging about 29 days on the market—so patience and realistic pricing are key.

The Strategy: If you are downsizing, selling your larger detached home right now allows you to cash in on a relatively stable market and buy into a condo or townhome segment that has seen some price corrections. It’s a great setup to pocket some serious equity.

☕ Let's Chat Over Coffee

Every neighbourhood—and every street—is behaving a little differently right now. Whether you're trying to figure out how much equity you have to downsize, or you're trying to purchase your very first home, you don't have to guess.

Click below, and let’s look at a customized plan for your specific goals.
👉 Request a Casual Market Consultation

What's happening locally? Durham Region & Toronto Insights

Read

🏡 May 2026 GTA Real Estate Market Update

The spring market accelerated in May as home sales rose 6.3% year-over-year. However, with new listings dropping sharply by nearly 19%, available winter inventory is being steadily absorbed, gradually shifting competition back into several GTA neighborhoods.

🔍 By the Numbers: May at a Glance

  • Total Sales: 6,583 (+6.3% YoY, +10.7% MoM seasonally adjusted)

  • Average Selling Price: $1,069,700 (–4.6% YoY, +1.7% MoM unadjusted)

  • Active Listings: 26,927 (–13.3% YoY)

  • New Listings: 17,698 (–18.9% YoY)

  • Days on Market:

    • Property DOM (PDOM): 42 days

    • Listing DOM (LDOM): 27 days

  • Months of Inventory (Trend): 4.8 months — Market tracks as BALANCED, but tightening monthly.

🧠 Top Takeaway

We are witnessing a persistent story of absorption. For the third consecutive month, GTA home sales outperformed last year’s figures. Because new supply plummeted by nearly 19% annually, existing standing inventory is thinning out. While average prices are still lower than they were in the spring of 2025, the month-over-month price bump shows that local competition is steadily returning.

What's happening locally? Durham Region & Toronto Insights

The suburban-urban divide continues to control individual market paces, creating distinct conditions depending on where you look.

🏘 Segment Performance

Detached Homes

  • Total Sales: 3,236 (+7.9% YoY)

  • Average Price: $1,358,131 (–4.7% YoY)

  • Market Status: Balanced. Detached properties saw the most active demand in May, specifically concentrated in the $1M to $1.5M price range.

Condo Apartments

  • Total Sales: 1,535 (+3.6% YoY)

  • Average Price: $639,468 (–6.4% YoY)

  • Market Status: Buyer-Leaning. Though condo demand has stabilized and stopped deteriorating, it remains the segment facing the heaviest annual price discounts.

Durham Region

  • Total Sales: 804 | New Listings: 1,978

  • Average Price: $851,065

  • Market Status: Balanced. Durham continues to represent the most price-accessible suburban alternative in the 905, maintaining steady absorption without hitting frantic price spikes.

City of Toronto (416)

  • Total Sales: 2,377 (+3.2% YoY)

  • Average Price: $1,108,292

  • Market Status: Balanced / Buyer-Leaning. Toronto proper remains highly active, but the large volume of existing options still guarantees substantial buyer leverage.

🏦 Economic & Financing Context

  • Bank of Canada Interest Rate: The central bank held its policy rate steady at 2.25% (with Prime at 4.5%) in its latest announcement. Economists suggest the Bank is navigating cautiously due to weak Q1 economic growth data mixed with persistent global supply risks.

  • The Renewal Trap: The Bank of Canada recently highlighted a rising trend where falling home prices over the past year could potentially trap a subset of GTA borrowers at renewal, limiting their ability to switch lenders if their equity has thinned out.

  • Mortgage Rate Realities: Five-year fixed rates are averaging roughly 5.09-5.09%, while short-term fixed rates sit between 4.64% and 4.89%. Borrowers are prioritizing fundamental budget planning over speculating on rapid future rate cuts. Variable rates are being offered below 4%.

🔄 What this means for you?

For Buyers:

Improved affordability remains your greatest asset this season, with average prices still sitting roughly $50,000 below last year's benchmarks. However, do not expect listings to linger indefinitely. Standing inventory fell 13.3% annually, meaning the "buyer's paradise" of endless choice is transitioning into a standard, balanced environment.

For Sellers:

The reduction in new supply (–18.9% YoY) works heavily in your favor. You are competing with far fewer newly listed homes than sellers did last spring. While aggressive overpricing will still leave a property sitting for over a month, accurate market pricing is yielding solid, efficient sales as buyer demand trends upward.

🔮 Quick Verdict

SegmentMarket Condition (May 2026)
CondosBuyer-Leaning (Great Entry Point)
Detached (GTA)Balanced (Highly Active)
Durham RegionBalanced (Steady & Accessible)
City of TorontoBalanced / Buyer-Leaning
Overall GTA MarketBalanced (4.8 MOI Trend)

📞 Get our family working for yours

The spring market has hit its peak, and inventory is moving. Successfully making a move right now relies entirely on understanding micro-local data—because a condo in Toronto demands a completely different strategy than a detached home in Durham. Let our experience guide your next transition.

👉 Contact us today to build your real estate strategy.

CONTACT THE JSA TEAM

📌 Supporting Sources

Read

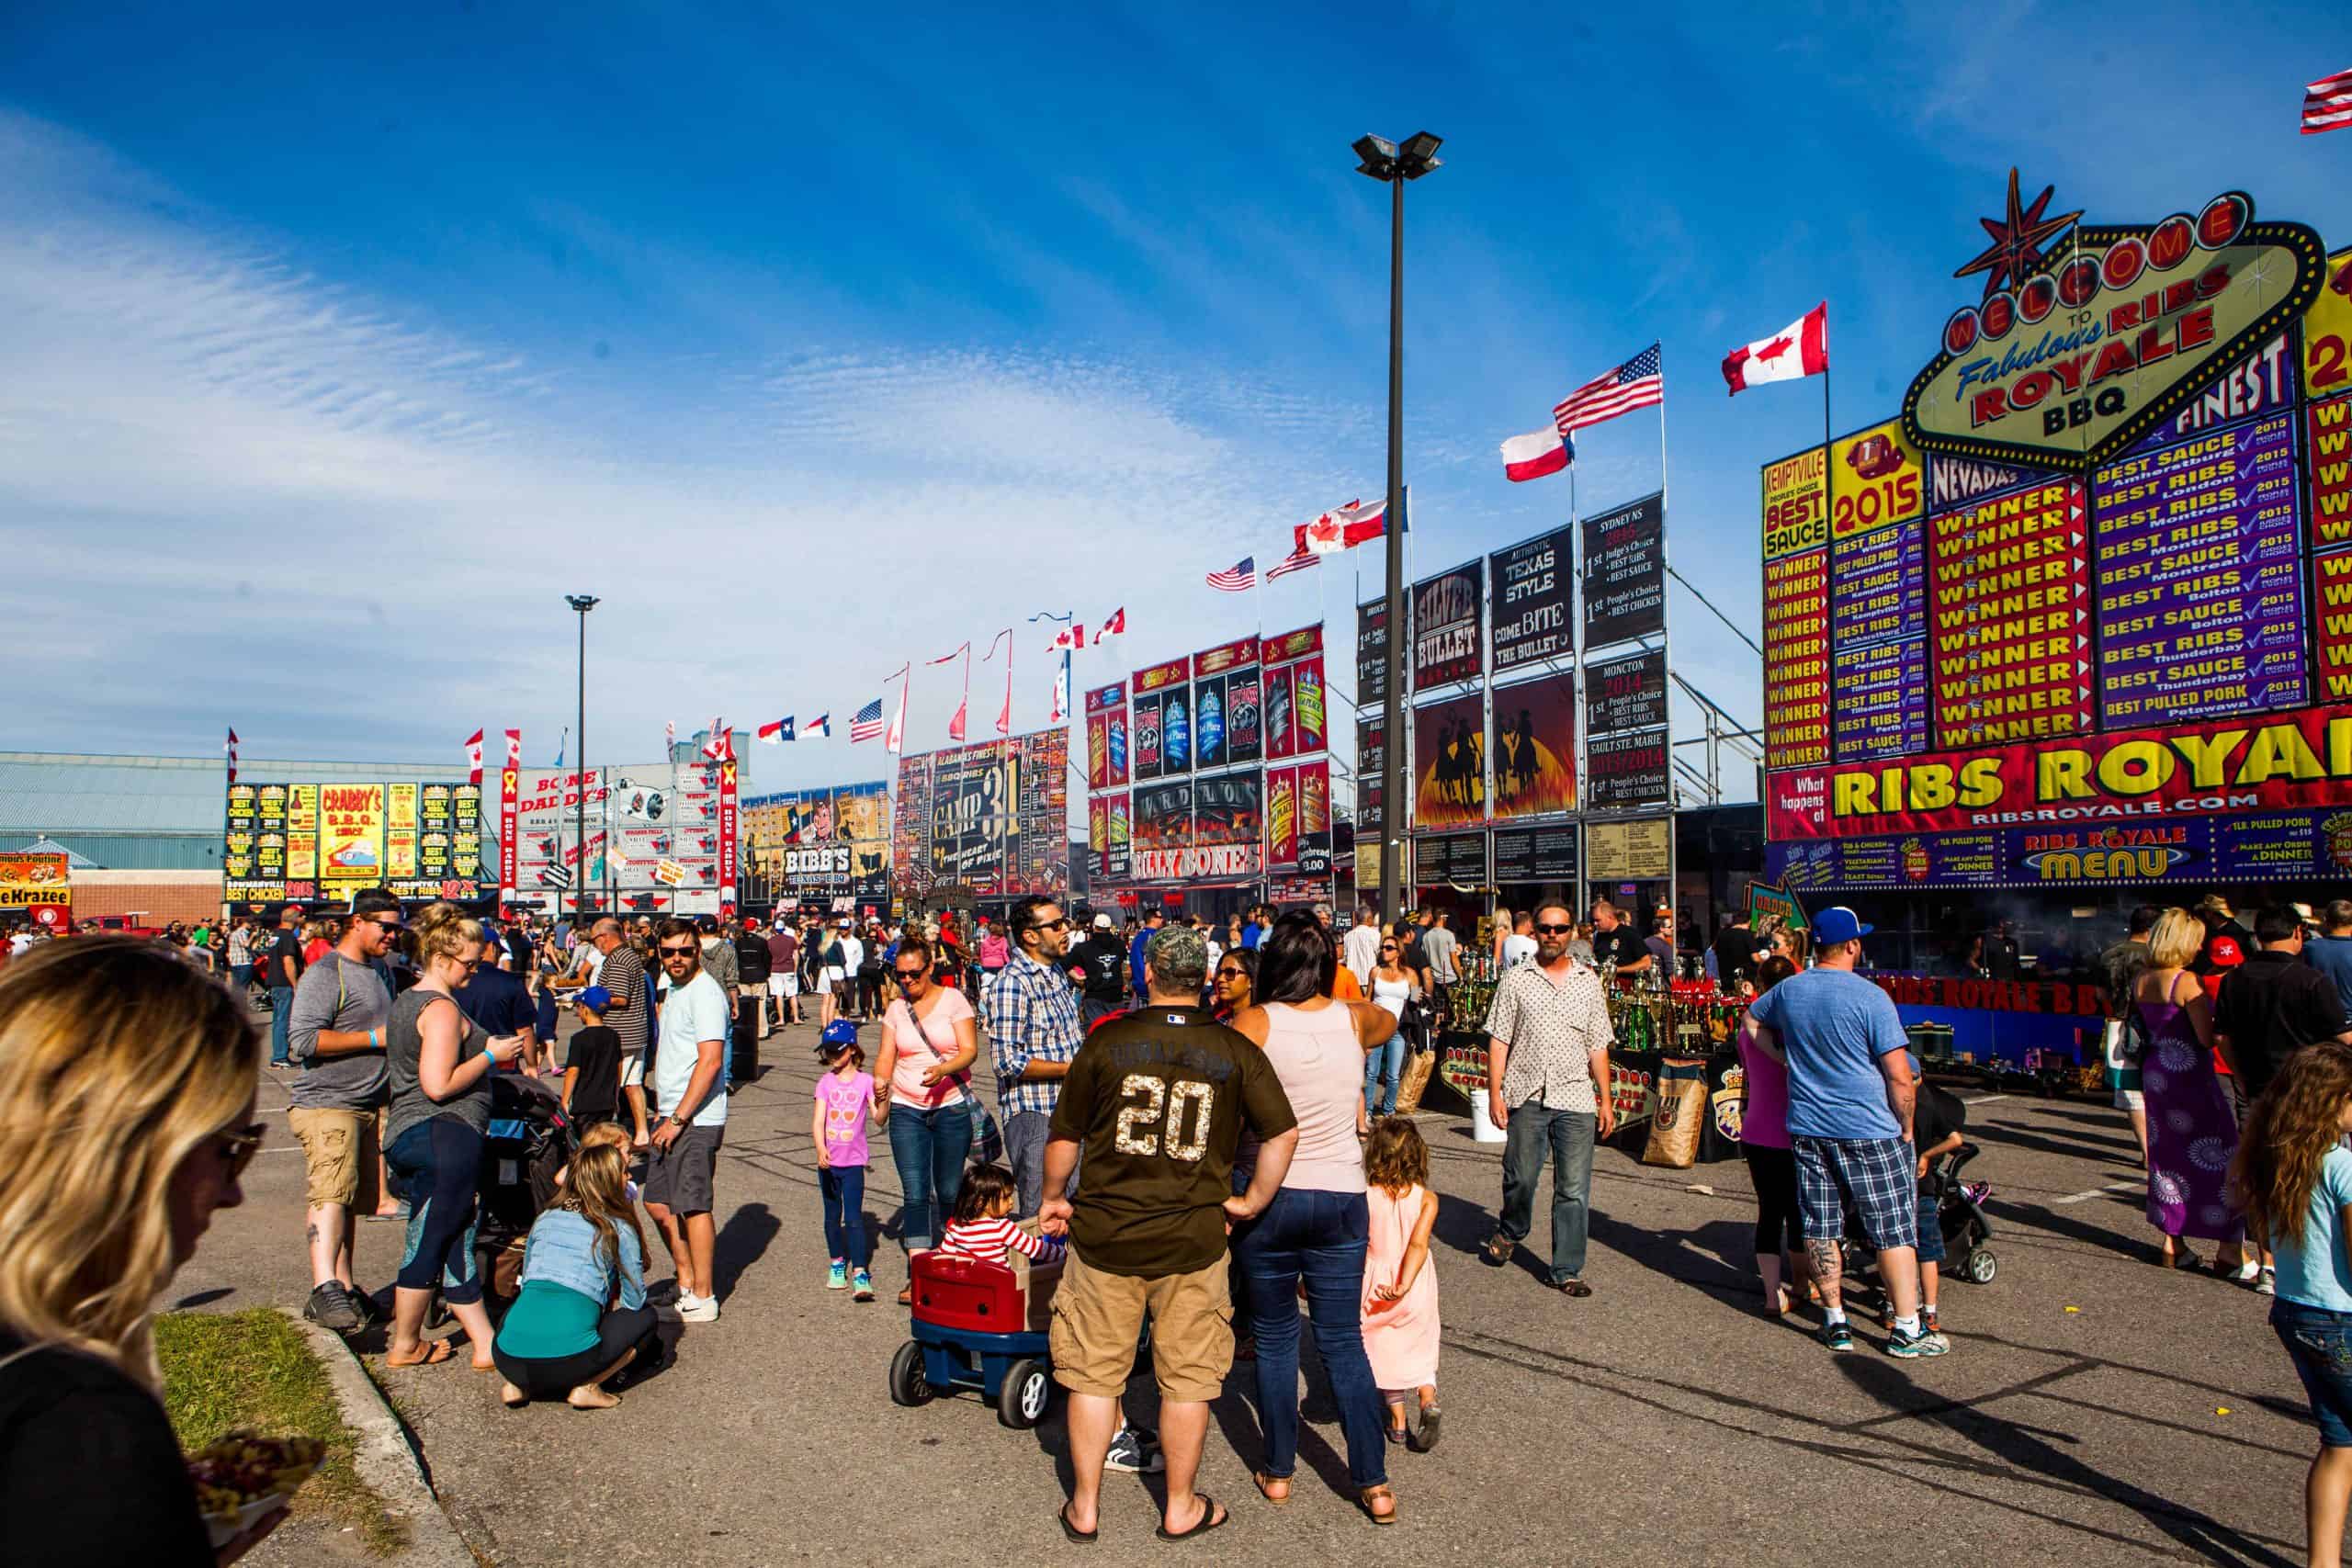
🍖🎉 Unleash Your Inner Foodie at Durham Region's Sizzling 2026 RibFest Events! 🍖🎉

Hey Durham Region foodies! Summer 2026 is officially here, and you know what that means: it’s time to roll up your sleeves, grab a stack of wet wipes, and get ready for the most delicious time of the year.

Whether you’re a die-hard fan of smoky beef ribs, a sucker for pulled pork, or just live for the festival vibe, the Durham Region has some incredible weekends lined up for you. As your local real estate expert, I don’t just help you find your dream home—I want to make sure you love the community you live in. And nothing says community quite like a local RibFest!

Grab your calendar and note these essential dates for the 2026 season.

📅 The 2026 Durham Region RibFest Roadmap

1. Pickering Rotary RibFest

  • When: June 19, 20, & 21, 2026

  • Where: Esplanade Park (1 The Esplanade N, Pickering)

  • The Vibe: Kick off your summer right in the heart of Pickering! With over ten championship pit-masters competing for the coveted "Best Ribs" trophy, Esplanade Park transforms into a smoky paradise. Beyond the ribs, you’ll find amazing craft brews, blooming onions, and live bands playing all weekend long. Admission is free, with a suggested $5 donation at the gate supporting local charity.

2. Whitby RibFest PLUS (Featuring The Trews!)

  • When: July 10, 11, & 12, 2026

  • Where: Whitby Victoria Fields (203-269 Victoria St W, Whitby)

  • The Vibe: Whitby is pulling out all the stops for 2026! Things kick off with a massive bang on Friday, July 10th with a dedicated, ticketed Concert Zone. Canadian rock legends The Trews are headlining the main stage, supported by Feral Minks, HIGHTEENS, and Bad Thieves. If you want to rock out to hits like "Not Ready to Go" while smelling world-class BBQ, you need to grab your concert tickets early.

Note: Don't want to see the show but still want the food? No problem! The Public Rib Zone is free and open to everyone on Friday night with 5 star ribbers firing up the grills. Saturday and Sunday are free for everyone, featuring a full midway, marketplace vendors, and Kidsfest! Official parking is located at the Henry/Victoria St. GO Transit lot.

3. Bowmanville RibFest

  • When: Mid-August 2026 (Stay tuned for exact weekend times)

  • The Vibe: Great news for Clarington residents! After a brief hiatus due to venue changes, Bowmanville RibFest is officially back at its debut location. Keep an eye out for local announcements as the town revives this incredibly popular community tradition.

🛑 Important 2026 Update: Oshawa Rotary RibFest Cancelled

If you usually head down to Lakeview Park in August for the Oshawa RibFest, please take note: after an incredible 25-year run, the Oshawa Rotary Club has made the difficult decision to cancel the 2026 event due to rising operational costs and economic pressures. While we are sad to miss it this year, the city and organizers are hopeful to bring Durham’s longest-running festival back in 2027!

💡 Quick Tips to Conquer RibFest Like a Pro:

  • Go Early: Beating the 5:00 PM dinner rush means shorter lines and the freshest racks straight off the wood fires.

  • Bring Cash: While many vendors accept card, cash is still king for quick transactions, local marketplace stalls, and donating at the gates.

  • Carpool or Transit: Parking gets packed fast! For the Whitby event, utilize the nearby GO Transit lot to keep the local neighborhood clear.

Thinking of Making Durham Region Your Home?

One of the best parts of living in Durham is the vibrant community spirit and incredible local events like these. If you are looking to buy, sell, or just want to chat about the market in Pickering, Whitby, Oshawa, or Clarington, I’m always here to help.

Enjoy the ribs, rock out to The Trews, and I’ll see you out in the community!

– Jim Stanton, Your Durham Region Real Estate Expert

Read

🏡 April 2026 GTA Real Estate Market Update

While the spring surge is in full effect with sales up 7% year-over-year, a significant volume of active listings is keeping the market balanced and providing buyers with continued negotiating power.


🔍 By the Numbers: April at a Glance

  • Total Sales: 5,946 (+7.0% YoY)

  • Average Selling Price: $1,051,969 (–4.9% YoY)

  • Active Listings: 25,110 (–6.4% YoY)

  • New Listings: 17,097 (–9.3% YoY)

  • Sales-to-New Listings Ratio (SNLR Trend): 34.6%

  • Days on Market (Avg. PDOM): 43 days

  • Months of Inventory (Trend): 4.9 months — Market is solidly BALANCED.


🧠 Top Takeaway

Despite a healthy 7% increase in sales activity, the GTA currently has 4.9 months of inventory on a trend basis. This high level of choice for buyers is the primary reason why average selling prices have remained nearly 5% lower than last year, even as we move into the peak spring season.


What's happening locally? Durham Region & Toronto Insights

While the overall GTA is tightening, specific regions are moving at different speeds.


🏘 Segment Performance

Detached Homes

  • Total Sales: 2,759 (+9.2% YoY)

  • Average Price: $1,372,688 (–4.1% YoY)

  • Market Status: Balanced. Detached buyers are finding more opportunities than last year as prices edge down despite rising sales.

Condo Apartments

  • Total Sales: 1,553 (+9.1% YoY)

  • Average Price: $635,653 (–6.3% YoY)

  • Market Status: Buyer-Leaning. Condos remain the most affordable entry point and continue to offer the most significant price discounts compared to 2025.

Durham Region

  • Average Price: $844,018

  • Months of Inventory: 3.5 months

  • Status: While tighter than the GTA average, Durham has moved into a more comfortable balanced territory.

City of Toronto

  • Average Price: $1,091,761

  • Months of Inventory: 4.9 months

  • Status: Solidly a Buyer's Market. With nearly 5 months of supply, Toronto buyers have substantial leverage on both price and terms.


🏦 Economic & Financing Context

  • Bank of Canada: The policy rate sits at 2.3%, with the Prime Rate at 4.5%.

  • Mortgage Rates: Fixed rates are holding steady, with 5-year rates at 6.09% and 3-year rates at 6.05%.

  • Economic Headwinds: GDP growth was flat-to-negative (–0.6%) in Q4 2025, and Toronto's unemployment rate has reached 8.1%. This economic cooling is acting as a natural brake on rapid price appreciation.


🔄 What this means for you?

For Buyers: You are in a rare position for a Toronto spring. Typically, inventory dries up by April, but with 4.9 months of supply, you have time to be picky. Average prices are down nearly $55,000 from last April, making this one of the most accessible spring markets in years.

For Sellers: Competition is high—not just from other sellers, but from the sheer volume of active listings (over 25,000 across the GTA). To stand out, your property must be priced sharply and presented perfectly. Buyers have "ample choice," so they will naturally gravitate toward the best value.


🔮 Quick Verdict

SegmentMarket Condition (April 2026)
Condos

Buyer-Leaning (High Choice)

Detached (GTA)

Balanced

Durham Region

Balanced (3.5 MOI)

City of Toronto

Buyer-Leaning (4.9 MOI)

Overall GTA Market

Balanced (4.9 MOI Trend)


📞 Get our family working for yours

The market has shifted gears. We’ve moved from a quiet winter into a fast-paced spring where inventory is the primary challenge. Whether you’re looking to capitalize on lower year-over-year prices or want to list while competition is low, we have the tailored strategy you need.

👉 Contact us today to navigate the spring market with confidence.

CONTACT THE JSA TEAM


📌 Supporting Sources

Read

🏡 March 2026 GTA Real Estate Market Update

Spring is stirring: March home sales jumped over 30% from February as buyers moved to capitalize on improved affordability and significant negotiating power before the market tightens further.


🔍 By the Numbers: March at a Glance

  • Total Sales: 5,039 (+1.7% YoY, +30.27% MoM)

  • Average Selling Price: $1,017,796 (–6.7% YoY, +0.9% MoM)

  • Active Listings: 21,596 (–8.0% YoY, +11.8% MoM)

  • New Listings: 14,442 (–16.7% YoY)

  • Sales-to-New Listings Ratio: 35% (Up from 29% last year)

  • Days on Market:

    • Property DOM: 47 days (Down 13% from February)

    • Listing DOM: 31 days

  • Months of Inventory: 4.29 months — Market remains BALANCED.


🧠 Top Takeaway

The "Spring Surge" has arrived, but with a twist. While sales volume skyrocketed 30% month-over-month, new listings fell nearly 17% compared to last year. This tightening of supply means that while buyers still enjoy negotiating power today, the window of "flat" pricing may be closing as we move deeper into 2026.


What's happening locally? Durham Region Market Insights

While the broader GTA sits in balanced territory, local pockets like Durham are showing signs of a much faster recovery.


🏘 Segment Performance

Condos

  • ~ 28.2% of total sales

  • Average Price: $620,479

  • 5.4 months of supply → Remains a Firm Buyer’s Market, though inventory is being absorbed faster as new listings fail to keep pace with sales.

Detached Homes

  • ~ 44.4% of total sales

  • Average Price: $1,342,375

  • 4.17 months of supply → Balanced Market.

Durham Region

  • 392 Sales | Average Price: $850,304

  • 2.96 months of inventory → Inventory has dipped below the 3-month mark, a strong signal for sellers. Durham continues to be the GTA's top performer for seller-favorable conditions.

City of Toronto

  • 951 Sales | 4,912 Listings

  • 5.17 months of inventory → Buyer’s Market. The 416 remains the best bet for buyers looking for maximum choice.


🏦 Economic & Financing Context

  • Bank of Canada: The policy rate was held steady at 2.25% on March 18, 2026. The next announcement is set for April 29, with markets pricing in a 96% chance of another hold.

  • Bond Market & Fixed Rates: 5-year Government of Canada bond yields are hovering near 3.06%. This has caused some fixed mortgage rates to edge slightly higher recently, making the cost of "breaking" a mortgage more expensive for some.

  • The "Renewal Crunch": A recent TD study found that 56% of homeowners are cutting discretionary spending to prepare for higher payments at renewal.

  • Stirring Demand: Despite renewal stress, 30% of prospective buyers say they are more likely to purchase before year-end, citing lower prices and rate stability as the primary "green lights".


🔄 What this means for you?

For Buyers:

The surface is beginning to bubble. While you still have "substantial negotiating power", the 16.7% drop in new listings suggests that the massive inventory selection we saw in January is starting to be absorbed. If you are one of the 75% of buyers currently saving for a down payment, now is the time to finalize your pre-approval before the "missing middle" supply tightens further.

For Sellers:

Inventory in the GTA is currently 8% lower than last year. In areas like Durham, where inventory is under 3 months, you are in a much stronger position than the "Buyer's Market" headlines suggest. With properties selling 13% faster than last month, the market is picking up speed—but correct pricing remains the bridge to a successful sale.


🔮 Quick Verdict

SegmentMarket Condition (March 2026)
CondosFirm Buyer’s Market (~5.4 MOI)
Detached (GTA)Balanced (~4.2 MOI)
Durham Region HomesBalanced / Leaning Seller (~3.0 MOI)
City of TorontoBuyer’s Market (~5.2 MOI)
Overall GTA MarketBalanced (~4.3 MOI)

📞 Get our family working for yours

The market is shifting from "wait and see" to "active and moving." A cookie-cutter approach won't work when one neighborhood is in a Buyer's Market and the next is leaning toward Sellers. If you need help navigating these tightening conditions, reach out. We tailor our strategy to meet your unique goals.

👉 Contact us today to stay ahead of the spring market curve.

CONTACT THE JSA TEAM


📌 Supporting Sources

Read

🏡 February 2026 GTA Real Estate Market Update

February saw the GTA average price climb back above the $1 million mark, but with nearly five months of inventory, buyers still hold the cards as we head toward the spring market.


🔍 By the Numbers: February at a Glance

  • Total Sales: 3,868 (–6.3% YoY, +25.5% MoM)

  • Average Selling Price: $1,008,968 (–7.1% YoY, +3.7% MoM)

  • Active Listings: 19,314 (–2.4% YoY, +7.4% MoM)

  • Sales-to-New Listings Ratio: ~36%

  • Days on Market:

    • Property DOM: 54 days

    • Listing DOM: 36 days

  • Months of Inventory: 4.99 months — Balanced overall, but continuing to favor buyers.


🧠 Top Takeaway

While sales activity jumped 25% compared to a quiet January, the market remains in a tug-of-war. New listings are down nearly 18% year-over-year, which is actually tightening conditions in some pockets—yet the overall inventory level of nearly 5 months ensures that buyers aren't feeling the typical spring "pressure" just yet.


What's happening locally? Durham Region Market Insights

Every city and town is unique. While the broader GTA is leaning buyer-friendly, Durham remains the region's "hot pocket" for sellers.


🏘 Segment Performance

Condos

  • ~ 28.1% of total sales

  • Average Price: $626,650

  • 6.57 months of supply → Remains a Firm Buyer’s Market.

Detached Homes

  • ~ 43.5% of total sales

  • Average Price: $1,325,654

  • 4.8 months of supply → Balanced Market.

Durham Region

  • 454 Sales | Average Price: $850,304

  • 3.6 months of inventory → Balanced conditions. Durham continues to outperform the broader GTA in terms of seller-favorable conditions.

City of Toronto

  • 4.96 months of inventory → Balanced Market. While still favoring buyers, the 416 became significantly more balanced in February compared to the start of the year.


🏦 Economic & Financing Context

  • Bank of Canada Outlook: The BoC held the policy rate at 2.25% in January. All eyes are now on the March 18 announcement. Most major banks (BMO, RBC, TD) forecast another hold at 2.25%, as the Bank waits to see the full impact of trade uncertainty and recent inflation data.

  • The Bond Market & Fixed Rates: Government of Canada 5-year bond yields have hovered around 2.7%. This stability has kept 5-year fixed mortgage rates in a predictable range (approx. 3.89% – 4.55% depending on the lender), providing a "stability window" for those looking to lock in before any potential spring volatility.

  • The "Wait and See" Effect: TRREB notes that over 100,000 potential buyers are currently sidelined, waiting for prices to fully level off or for positive news regarding international trade.


🔄 What this means for you?

For Buyers:

The "herd mentality" hasn't kicked in yet. While the average price moved back over $1M, the 4.99 months of inventory means you still have room to negotiate. The window to buy before the "pent-up demand" (estimated at 100k+ buyers) returns is still open.

For Sellers:

Inventory is slowly rising (+7.4% MoM), but new listings are actually down 17.7% compared to last year. This means that if you have a well-prepared, properly priced home, you have less new competition than you might think. Strategic pricing remains the #1 factor in a 5-month inventory market.


🔮 Quick Verdict

SegmentMarket Condition (Feb 2026)
CondosFirm Buyer’s Market (~6.6 MOI)
Detached (GTA)Balanced (~4.8 MOI)
Durham Region HomesBalanced (~3.6 MOI)
City of TorontoBalanced (~5.0 MOI)
Overall GTA MarketBalanced / Favouring Buyers (~5.0 MOI)

📞 Get our family working for yours

Whether you’re planning to buy, sell, or simply get a grasp of what lies ahead, we’re here to help you make informed, confident real estate decisions. The market is showing signs of a "second-half" surge—don't wait until the competition heats up to build your strategy.

👉 Contact us today to navigate the spring market with confidence.

CONTACT THE JSA TEAM

Read
Categories:   2022 | 2023 | 2024 | 2024 Real Estate Market | 2024 Year in Review | 2025 | 2025 Real Estate forecast | 2025 real estate predictions | 2026 | 2026 Real Estate Forecast | attractions | back to school | Bank of Canada | Benjamin Tal | best lawn fertilizer | best weed killer | buyers | buying a home | Canada Economy | Centennial, Oshawa Real Estate | Central Oshawa Go Train Station | Christmas | Christmas Markets | CIBC | City of Oshawa | clean gutters | clean gutters and downspouts | cleaning your deck | corn gluten | corn gluten meal | coronavirus | covid-19 | covid-19, coronavirus | credit card rate cuts, mortgage payment deferrals, COVID-19, coronavirus | curb appeal | December 2023 Market Update | deck | downspouts | drainage | Durham | Durham Region | durham region home sales | durham region tourism | Fall Market | farms in durham | February 2023 | February 2024 | fertilizer | financing | gardens | Go Train | Go Transit | government of ontario | GTA | GTA Real Estate Stats | gutter | gutter guards | gutter maintenance | gutters | Holiday Markets | Holiday Season | home maintenance | Housing Forecast | interest rates | Ipsos | January 2023 | January 2026 Real Estate Market | July 2023 | June 2023 | June 2026 Market Snapshot | Lakeshore East Go Train Expansion | lawn | lawn and garden | lawn care | leak prevention | Local | local artisans | lush green lawn | Maker Markets | March 2023 | March 2025 | market | Market Outlook | market snapshot | Market Stats | market update | market watch | May 2023 | May 2024 | May 2025 Market Snapshot | mortgage | mortgage rates | New Development in Central Oshawa | October 2023 | ontario | ontario government | Open Offer Process | oshawa | oshawa botanical garden | Oshawa Go | Parade | parenting | parks | peony festivael | pick your own strawberries | Picks & Giggles | re-open | real estate legislation | Real Estate Market | Real Estate Market Stats | Real Estate Statistics | real estate stats | Real Estate Trends | Redevelopment in Durham Region | ReMax | Remembrance Day | Residential Commercial Development in Oshawa | ribfest | sales forecast | Santa | Santa Claus | Santa Claus Parade | school | September 2023 | site seeing | social distancing | spring cleaning | spring market | strawberries | summer events | summer home maintenance | Toronto | Toronto Regional Real Estate Board | TRESA | TRREB | TRREB Stats | Trust in Real Estate Services Act | week killer | Zoocasa
This website may only be used by consumers that have a bona fide interest in the purchase, sale, or lease of real estate of the type being offered via the website. The data relating to real estate on this website comes in part from the MLS® Reciprocity program of the PropTx MLS®. The data is deemed reliable but is not guaranteed to be accurate.